California's 37th congressional district
| California's 37th congressional district | ||
|---|---|---|
.tif.png) | ||
| Current Representative | Karen Bass (D–Los Angeles) | |
| Ethnicity | 24.3% White, 24.6% Black, 9.3% Asian, 38.6% Hispanic, 3.3[1]% other | |
| Cook PVI | D+34 | |
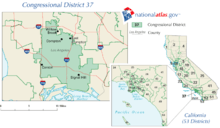
California's 37th congressional district is a congressional district in the U.S. state of California based in Los Angeles County. It is composed of traditionally African-American neighborhoods west and Southwest of Downtown Los Angeles
The District includes
- Culver City
- the City of Los Angeles neighborhoods of Mid City, West Los Angeles, Century City, Palms, Mar Vista, Sawtelle, Beverlywood, Cheviot Hills, Pico-Robertson, Exposition Park, University Park, Vermont Knolls, West Adams, Leimert Park, Jefferson Park, Vermont Square, Ladera Heights, Hyde Park, Crenshaw, View Park-Windsor Hills, and Baldwin Hills.
The district is currently represented by Democrat Karen Bass.
Demographics
The district is highly diverse ethnically. Approximately half of the district's residents are Hispanic and a quarter are African American with the remainder being a mix of Caucasian, Asian, and other ethnic groups.
Voting
| Election results from statewide races | ||
|---|---|---|
| Year | Office | Results |
| 2010 | Governor | Brown 74.1 - 20.3% |
| Senator | Boxer 73.7 - 20.5% | |
| 2008 | President[2] | Obama 79.6 - 18.7% |
| 2006 | Governor[3] | Angelides 60.6 - 33.9% |
| Senator[4] | Feinstein 76.6 - 18.0% | |
| 2004 | President[5] | Kerry 73.5 - 25.2% |
| Senator[6] | Boxer 76.3 - 18.1% | |
| 2003 | Recall[7][8] | No 59.3 - 40.7% |
| Bustamante 44.3 - 36.7% | ||
| 2002 | Governor[9] | Davis 67.7 - 23.6% |
| 2000 | President[10] | Gore 82.8 - 14.8% |
| Senator[11] | Feinstein 82.8 - 11.8% | |
| 1998 | Governor | |
| Senator | ||
| 1996 | President | |
| 1994 | Governor | |
| Senator | ||
| 1992 | President | Clinton 73.8 - 15.7% |
| Senator | Boxer 70.9 - 21.4% | |
| Senator | Feinstein 75.7 - 17.7% | |
List of representatives
| Representative | Party | Dates | Notes | Counties |
|---|---|---|---|---|
| District created | January 3, 1963 | |||
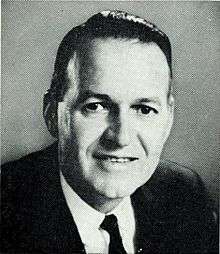 Lionel Van Deerlin Lionel Van Deerlin |
Democratic | January 3, 1963 – January 3, 1967 |
San Diego (City of San Diego) | |
| January 3, 1967 – January 3, 1973 |
Redistricted to the 41st district | Eastern/southern San Diego | ||
 Yvonne Brathwaite Burke Yvonne Brathwaite Burke |
Democratic | January 3, 1973 – January 3, 1975 |
Redistricted to the 28th district | Los Angeles |
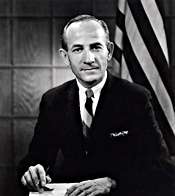 Jerry Pettis Jerry Pettis |
Republican | January 3, 1975 – February 14, 1975 |
Redistricted from the 33rd district Died |
Riverside, San Bernardino |
| Vacant | February 14, 1975 – April 29, 1975 | |||
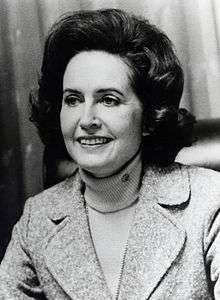 Shirley Neil Pettis Shirley Neil Pettis |
Republican | April 29, 1975 – January 3, 1979 |
Retired | |
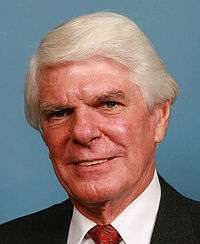 Jerry Lewis Jerry Lewis |
Republican | January 3, 1979 – January 3, 1983 |
Redistricted to the 35th district | |
 Al McCandless Al McCandless |
Republican | January 3, 1983 – January 3, 1993 |
Redistricted to the 44th district | Riverside |
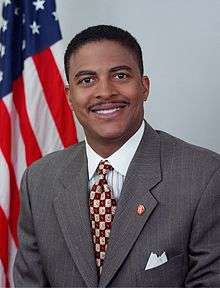 Walter R. Tucker III Walter R. Tucker III |
Democratic | January 3, 1993 – December 15, 1995 |
Resigned | Los Angeles (Compton, Carson, Long Beach) |
| Vacant | December 15, 1995 – March 26, 1996 |
|||
 Juanita Millender-McDonald Juanita Millender-McDonald |
Democratic | March 26, 1996 – April 22, 2007 |
Died | |
| Vacant | ||||
 Laura Richardson Laura Richardson |
Democratic | August 21, 2007 – January 3, 2013 |
Redistricted to the 44th district and lost | |
 Karen Bass Karen Bass |
Democratic | January 3, 2013 – present |
Redistricted from the 33rd district | West Los Angeles (Crenshaw, and Culver City) |
Election results
|
1962 • 1964 • 1966 • 1968 • 1970 • 1972 • 1974 • 1975 (Special) • 1976 • 1978 • 1980 • 1982 • 1984 • 1986 • 1988 • 1990 • 1992 • 1994 • 1996 (Special) • 1996 • 1998 • 2000 • 2002 • 2004 • 2006 • 2007 (Special) • 2008 • 2010 • 2012 • 2014 |
1962
| Party | Candidate | Votes | % | ||
|---|---|---|---|---|---|
| Democratic | Lionel Van Deerlin (inc.) | 63,821 | 51.4 | ||
| Republican | Dick Wilson | 60,460 | 48.6 | ||
| Total votes | 124,281 | 100.0 | |||
| Voter turnout | % | ||||
| Democratic win (new seat) | |||||
1964
| Party | Candidate | Votes | % | |
|---|---|---|---|---|
| Democratic | Lionel Van Deerlin (inc.) | 85,624 | 58.2 | |
| Republican | Dick Wilson | 61,373 | 41.8 | |
| Total votes | 146,997 | 100.0 | ||
| Voter turnout | % | |||
| Democratic hold | ||||
1966
| Party | Candidate | Votes | % | |
|---|---|---|---|---|
| Democratic | Lionel Van Deerlin (inc.) | 80,060 | 61.2 | |
| Republican | Mike Schaefer | 50,817 | 38.8 | |
| Total votes | 130,877 | 100.0 | ||
| Voter turnout | % | |||
| Democratic hold | ||||
1968
| Party | Candidate | Votes | % | |
|---|---|---|---|---|
| Democratic | Lionel Van Deerlin (inc.) | 95,591 | 64.7 | |
| Republican | Mike Schaefer | 52,212 | 35.3 | |
| Total votes | 147,803 | 100.0 | ||
| Voter turnout | % | |||
| Democratic hold | ||||
1970
| Party | Candidate | Votes | % | |
|---|---|---|---|---|
| Democratic | Lionel Van Deerlin (inc.) | 93,952 | 72.1 | |
| Republican | James B. Kuhn | 31,968 | 24.5 | |
| American Independent | Faye B. Brice | 2,962 | 2.3 | |
| Peace and Freedom | Fritjof Thygeson | 1,386 | 1.1 | |
| Total votes | 130,268 | 100.0 | ||
| Voter turnout | % | |||
| Democratic hold | ||||
1972
| Party | Candidate | Votes | % | ||
|---|---|---|---|---|---|
| Democratic | Yvonne Brathwaite Burke (I) | 120,392 | 73.2 | ||
| Republican | Greg Tria | 40,633 | 24.7 | ||
| Peace and Freedom | John Hagg | 3,485 | 2.1 | ||
| Total votes | 164,510 | 100.0 | |||
| Voter turnout | % | ||||
| Democratic win (new seat) | |||||
1974
| Party | Candidate | Votes | % | |
|---|---|---|---|---|
| Republican | Jerry Pettis (incumbent) | 88,548 | 63.2 | |
| Democratic | Bobby Ray Vincent | 46,449 | 32.9 | |
| American Independent | John H. Ortman | 5,522 | 3.9 | |
| Total votes | 140,519 | 100.0 | ||
| Voter turnout | % | |||
| Republican hold | ||||
1975 (Special)
| Party | Candidate | Votes | % | |
|---|---|---|---|---|
| Republican | Shirley Neil Pettis | ' | 60.5 | |
| Democratic | Ron Pettis | 14.7 | ||
| Democratic | James L. Mayfield | 12.7 | ||
| Republican | Frank M. Bogert | 5.4 | ||
| American Independent | Bernard Wahl | 1.6 | ||
| Democratic | Joe E. Hubbs, Sr. | 1.3 | ||
| Republican | Louis Martinez | 1.0 | ||
| Republican | Jack H. Harrison | 0.8 | ||
| Democratic | Clodeon Speed Adkins | 0.6 | ||
| Republican | Bud Mathewson | 0.6 | ||
| Democratic | C. L. "Jimmie" James | 0.4 | ||
| Democratic | Richard "Doc" Welby | 0.3 | ||
| Republican | Robert J. Allenthorp | 0.2 | ||
| Total votes | {{{votes}}} | 100.0 | ||
| Voter turnout | % | |||
| Republican hold | ||||
1976
| Party | Candidate | Votes | % | |
|---|---|---|---|---|
| Republican | Shirley Neil Pettis (incumbent) | 133,634 | 71.1 | |
| Democratic | Douglas C. Nilson Jr. | 49,021 | 26.1 | |
| American Independent | Bernard Wahl | 5,352 | 2.8 | |
| Total votes | 188,007 | 100.0 | ||
| Voter turnout | % | |||
| Republican hold | ||||
1978
| Party | Candidate | Votes | % | |
|---|---|---|---|---|
| Republican | Jerry Lewis | 106,581 | 61.4 | |
| Democratic | Dan Corcoran | 60,463 | 34.8 | |
| American Independent | Bernard Wahl | 6,544 | 3.8 | |
| Total votes | 173,588 | 100.0 | ||
| Voter turnout | % | |||
| Republican hold | ||||
1980
| Party | Candidate | Votes | % | |
|---|---|---|---|---|
| Republican | Jerry Lewis (incumbent) | 165,371 | 71.6 | |
| Democratic | Donald M. "Don" Rusk | 58,091 | 25.1 | |
| Libertarian | Larry Morris | 7,615 | 3.3 | |
| Total votes | 231,077 | 100.0 | ||
| Voter turnout | % | |||
| Republican hold | ||||
1982
| Party | Candidate | Votes | % | |
|---|---|---|---|---|
| Republican | Al McCandless | 105,065 | 59.1 | |
| Democratic | Curtis R. "Sam" Cross | 68,510 | 38.5 | |
| Libertarian | Marc R. Wruble | 4,297 | 2.4 | |
| Total votes | 177,872 | 100.0 | ||
| Voter turnout | % | |||
| Republican hold | ||||
1984
| Party | Candidate | Votes | % | |
|---|---|---|---|---|
| Republican | Al McCandless (incumbent) | 149,955 | 63.6 | |
| Democratic | David E. "Dave" Skinner | 85,908 | 36.4 | |
| Total votes | 245,863 | 100.0 | ||
| Voter turnout | % | |||
| Republican hold | ||||
1986
| Party | Candidate | Votes | % | |
|---|---|---|---|---|
| Republican | Al McCandless (incumbent) | 122,416 | 63.7 | |
| Democratic | David E. "Dave" Skinner | 69,808 | 36.3 | |
| Total votes | 192,224 | 100.0 | ||
| Voter turnout | % | |||
| Republican hold | ||||
1988
| Party | Candidate | Votes | % | |
|---|---|---|---|---|
| Republican | Al McCandless (incumbent) | 174,284 | 64.3 | |
| Democratic | Johnny Pearson | 89,666 | 33.1 | |
| Libertarian | Bonnie Flickinger | 7,169 | 2.6 | |
| No party | Write-ins | 123 | 0.0% | |
| Total votes | 271,242 | 100.0 | ||
| Voter turnout | % | |||
| Republican hold | ||||
1990
| Party | Candidate | Votes | % | |
|---|---|---|---|---|
| Republican | Al McCandless (incumbent) | 115,469 | 49.8 | |
| Democratic | Ralph Waite | 103,961 | 44.8 | |
| American Independent | Gary R. Odom | 6,474 | 2.8 | |
| Libertarian | Bonnie Flickinger | 6,178 | 2.7 | |
| Total votes | 232,082 | 100.0 | ||
| Voter turnout | % | |||
| Republican hold | ||||
1992
| Party | Candidate | Votes | % | |
|---|---|---|---|---|
| Democratic | Walter R. Tucker III (inc.) | 97,159 | 85.7 | |
| Peace and Freedom | B. Kwaku Duren | 16,178 | 14.3 | |
| Total votes | 113,337 | 100.0 | ||
| Voter turnout | % | |||
| Democratic hold | ||||
1994
| Party | Candidate | Votes | % | |
|---|---|---|---|---|
| Democratic | Walter R. Tucker III (inc.) | 64,166 | 77.37 | |
| Libertarian | Guy Wilson | 18,502 | 22.31 | |
| No party | Prulitsky (write-in) | 263 | 0.32% | |
| Total votes | 82,931 | 100.0 | ||
| Voter turnout | % | |||
| Democratic hold | ||||
1996 (Special)
| Party | Candidate | Votes | % | |
|---|---|---|---|---|
| Democratic | Juanita Millender-McDonald | 13,868 | 31.74 | |
| Democratic | Willard H. Murray, Jr. | 10,396 | 23.79 | |
| Democratic | Omar Bradley | 6,975 | 15.96 | |
| Democratic | Paul H. Richards | 6,035 | 13.81 | |
| Democratic | Charles Davis | 2,555 | 5.85 | |
| Democratic | Murry J. Carter | 1,574 | 3.60 | |
| Democratic | Joyce Harris | 1,322 | 3.03 | |
| Democratic | Robin Tucker | 513 | 1.17 | |
| Democratic | Robert M. Saucedo | 453 | 1.04 | |
| Total votes | 43,691 | 100.00 | ||
| Voter turnout | % | |||
| Democratic hold | ||||
1996
| Party | Candidate | Votes | % | |
|---|---|---|---|---|
| Democratic | Juanita Millender-McDonald-I | 87,247 | 85.0 | |
| Republican | Michael Voetee | 15,339 | 15.0 | |
| Total votes | 102,586 | 100.0 | ||
| Voter turnout | % | |||
| Democratic hold | ||||
1998
| Party | Candidate | Votes | % | |
|---|---|---|---|---|
| Democratic | Juanita Millender-McDonald-I | 70,026 | 85.06 | |
| Republican | Saul E. Lankster | 12,301 | 14.94 | |
| Total votes | 82,327 | 100.0 | ||
| Voter turnout | % | |||
| Democratic hold | ||||
2000
| Party | Candidate | Votes | % | |
|---|---|---|---|---|
| Democratic | Juanita Millender-McDonald-I | 93,269 | 82.4 | |
| Republican | Vernon Van | 12,762 | 11.3 | |
| Natural Law | Margaret Glazer | 4,094 | 3.6 | |
| Libertarian | Herb Peters | 3,150 | 2.7 | |
| Total votes | 113,275 | 100.0 | ||
| Voter turnout | % | |||
| Democratic hold | ||||
2002
| Party | Candidate | Votes | % | |
|---|---|---|---|---|
| Democratic | Juanita Millender-McDonald-I | 63,445 | 73.0 | |
| Republican | Oscar A. Velasco | 20,154 | 23.1 | |
| Libertarian | Herb Peters | 3,413 | 3.9 | |
| Total votes | 87,012 | 100.0 | ||
| Voter turnout | % | |||
| Democratic hold | ||||
2004
| Party | Candidate | Votes | % | |
|---|---|---|---|---|
| Democratic | Juanita Millender-McDonald-I | 118,823 | 75.1 | |
| Republican | Vernon Van | 31,960 | 20.2 | |
| Libertarian | Herb Peters | 7,535 | 4.7 | |
| Total votes | 158,318 | 100.0 | ||
| Voter turnout | % | |||
| Democratic hold | ||||
2006
| Party | Candidate | Votes | % | |
|---|---|---|---|---|
| Democratic | Juanita Millender-McDonald-I | 80,716 | 82.4 | |
| Libertarian | Herb Peters | 17,246 | 17.6 | |
| Total votes | 97,962 | ' | ||
| Democratic hold | ||||
2007 (Special)
| Party | Candidate | Votes | % | |
|---|---|---|---|---|
| Democratic | Laura Richardson | 11,956 | 67.05 | |
| Republican | John Kanaley | 5,309 | 25.24 | |
| Green | Daniel Brezenoff | 1,138 | 5.41 | |
| Libertarian | Herb Peters | 483 | 2.30 | |
| Total votes | 18,886 | 100.0 | ||
| Voter turnout | 8.6% | |||
| Democratic hold | ||||
2008
| Party | Candidate | Votes | % | |
|---|---|---|---|---|
| Democratic | Laura Richardson | 128,175 | 75.0 | |
| Independent | Nick Dibs | 25,498 | 15.0 | |
| Democratic | Peter Mathews (Write-In) | 17,000 | 10.0 | |
| Total votes | 169,973 | 100.0 | ||
| Voter turnout | % | |||
| Democratic hold | ||||
2010
| Party | Candidate | Votes | % | |
|---|---|---|---|---|
| Democratic | Laura Richardson | 85,799 | 68.36 | |
| Republican | Star Parker | 29,159 | 23.23 | |
| Independent | Nicholas Dibs | 10,560 | 8.41 | |
| Total votes | 125,518 | 100.00 | ||
| Voter turnout | % | |||
| Democratic hold | ||||
2012
| Party | Candidate | Votes | % | |
|---|---|---|---|---|
| Democratic | Karen Bass (incumbent) | 207,039 | 86% | |
| Republican | Morgan Osborne | 32,541 | 14% | |
| Total votes | 239,580 | 100% | ||
| Democratic hold | ||||
2014
| Party | Candidate | Votes | % | |
|---|---|---|---|---|
| Democratic | Karen Bass (incumbent) | 96,787 | 84% | |
| Republican | R. Adam King | 18,051 | 16% | |
| Total votes | 114,838 | 100% | ||
| Democratic hold | ||||
Living former Members
As of April 2015, there are six former members of the U.S. House of Representatives from California's 37th congressional district that are currently living.
| Representative | Term in office | Date of birth (and age) |
|---|---|---|
| Yvonne Brathwaite Burke | 1973 - 1975 | October 5, 1932 |
| Shirley N. Pettis | 1975 - 1979 | July 12, 1924 |
| Jerry Lewis | 1979 - 1983 | October 21, 1934 |
| Al McCandless | 1983 - 1993 | July 23, 1927 |
| Walter R. Tucker III | 1993 - 1995 | May 28, 1957 |
| Laura Richardson | 2007 - 2013 | April 14, 1962 |
Historical district boundaries
See also
References
- ↑ http://www.latimes.com/la-redistricting-map-july-2011,0,5339409.htmlstory#39.71057374407184,-118.14590136718749,5,usCongress,,,current
- ↑ (2008 President)
- ↑ Statement of Vote (2006 Governor)
- ↑ Statement of Vote (2006 Senator)
- ↑ Statement of Vote (2004 President)
- ↑ Statement of Vote (2004 Senator)
- ↑ Statement of Vote (2003 Recall Question)
- ↑ Statement of Vote (2003 Governor)
- ↑ Statement of Vote (2002 Governor)
- ↑ Statement of Vote (2000 President)
- ↑ Statement of Vote (2000 Senator)
- ↑ 1962 election results
- ↑ 1964 election results
- ↑ 1966 election results
- ↑ 1968 election results
- ↑ 1970 election results
- ↑ 1972 election results
- ↑ 1974 election results
- ↑ 1975 special election results
- ↑ 1976 election results
- ↑ 1978 election results
- ↑ 1980 election results
- ↑ 1982 election results
- ↑ 1984 election results
- ↑ 1986 election results
- ↑ 1988 election results
- ↑ 1990 election results
- ↑ 1992 election results
- ↑ 1994 election results
- ↑ 1996 special election results
- ↑ 1996 election results
- ↑ 1998 election results
- ↑ 2000 election results
- ↑ 2002 general election results Archived February 3, 2009, at the Wayback Machine.
- ↑ 2004 general election results
- ↑ 2006 general election results Archived November 27, 2008, at the Wayback Machine.
- ↑ 2012 general election results Archived October 19, 2013, at the Wayback Machine.
- ↑ 2012 general election results Archived October 19, 2013, at the Wayback Machine.
External links
- Current (post 2012) district map—GovTrack.us: California's 37th congressional district
- Historic district descriptions -- RAND California Election Returns: District Definitions
- Historic (2012 and earlier) district map -- California Voter Foundation map - CD37
Coordinates: 34°00′58″N 118°22′07″W / 34.01611°N 118.36861°W