List of countries by oil production

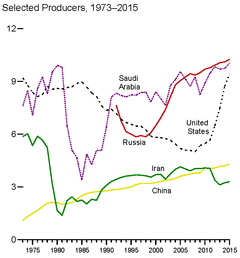
million bbl/day (EIA)
This is a list of countries by oil production.[1]
Trends
According to the International Energy Agency (IEA), in 2016, Saudi Arabia and Russia regained the #1 and #2 position after briefly losing it to the United States in 2015. Prior to that, in 2014 over 66% of world oil production came from the top ten countries: Saudi Arabia 542 Mt (13%), Russia 529 Mt (13%), United States 509 Mt (12%), China 212 Mt (5%), Canada 208 Mt (5%), Iran 166 Mt (4%), Iraq 160 Mt (4%), Kuwait 158 Mt (4%), United Arab Emirates 157 Mt (4%) and Venezuela 151 Mt (4%). Total oil production was 4,200 Mt.[2]
Countries


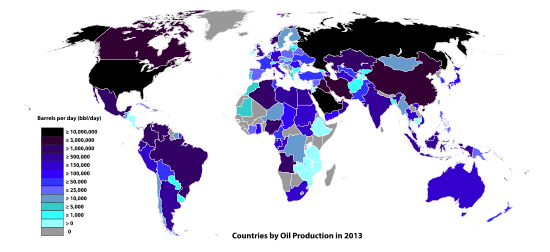
Total Petroleum and Other Liquids Production, 2014. ("Other liquids" include biofuels, liquids derived from coal and oil shale, and refinery gain.)[3]
World’s top oil producers 2016. (World’s top oil producers)[4]
| Country | Production (bbl/day) Top 10 countries updated 2016 | |
|---|---|---|
| 1 | 10,625,000 | |
| 2 | 10,254,000 | |
| 3 | 8,744,000 | |
| 4 | 4,415,000 | |
| 5 | 3,938,000 | |
| 6 | 3,920,000 | |
| 7 | 3,652,000 | |
| 8 | 3,188,000 | |
| 9 | 3,000,000 | |
| 10 | 2,624,000 | |
| 11 | 2,316,000 | |
| 12 | 2,193,000 | |
| 13 | 1,763,000 | |
| 14 | 1,746,000 | |
| 15 | 1,476,000 | |
| 16 | 1,507,000 | |
| 17 | 1,171,000 | |
| 18 | 978,000 | |
| 19 | 955,000 | |
| 20 | 876,000 | |
| 21 | 847,000 | |
| 22 | 736,000 | |
| 23 | 668,000 | |
| 24 | 639,000 | |
| 25 | 582,000 | |
| 26 | 555,000 | |
| 27 | 536,000 | |
| 28 | 528,000 | |
| 29 | 317,000 | |
| 30 | 312,000 | |
| 31 | 292,000 | |
| 32 | 265,000 | |
| 33 | 255,000 | |
| 34 | 235,000 | |
| 35 | 227,000 | |
| 36 | 210,000 | |
| 37 | 149,000 | |
| 38 | 115,000 | |
| 39 | 113,000 | |
| 40 | 90,000 | |
| 41 | 87,000 | |
| 42 | 85,000 (2015) | |
| 43 | 81,000 (2015) | |
| 44 | 80,000 | |
| 45 | 79,000 (2015) | |
| 46 | 76,000 (2015) | |
| 47 | 75,000 | |
| 48 | 67,000 (2015) | |
| 49 | 66,000 (2015) | |
| 50 | 64,000 (2015) | |
| 51 | 64,000 (2015) | |
| 52 | 61,000 (2015) | |
| 53 | 61,000 (2015) | |
| 54 | 59,000 | |
| 55 | 59,000 (2015) | |
| 56 | 50,000 (2015) | |
| 57 | 49,000 (2015) | |
| 58 | 48,000 | |
| 59 | 40,000 (2015) | |
| 60 | 39,000 (2015) | |
| 61 | 39,000 | |
| 62 | 37,000 (2015) | |
| 63 | 34,000 (2015) | |
| 64 | 33,000 (2015) | |
| 65 | 32,000 (2015) | |
| 66 | 27,000 (2015) | |
| 67 | 26,000 (2015) | |
| 68 | 25,000 (2015) | |
| 69 | 22,000 (2015) | |
| 70 | 22,000 | |
| 71 | 21,000 (2015) | |
| 72 | 21,000 (2015) | |
| 73 | 20,000 (2015) | |
| 74 | 20,000 (2015) | |
| 75 | 20,000 (2015) | |
| 76 | 18,000 (2015) | |
| 77 | 15,000 (2015) | |
| 78 | 15,000 (2015) | |
| 79 | 14,000 (2015) | |
| 80 | 14,000 (2015) | |
| 81 | 13,000 (2015) | |
| 82 | 13,000 (2015) | |
| 83 | 12,000 (2015) | |
| 84 | 11,000 (2015) | |
| 85 | 10,000 (2015) | |
| 86 | 9,100 (2015) | |
| 87 | 9,100 (2015) | |
| 88 | 8,700 (2015) | |
| 89 | 7,100 (2015) | |
| 90 | 6,000 (2015) | |
| 91 | 5,800 (2015) | |
| 92 | 5,100 (2015) | |
| 93 | 4,800 (2015) | |
| 94 | 4,000 | |
| 95 | 3,900 (2015) | |
| 96 | 3,400 (2015) | |
| 97 | 2,800 (2015) | |
| 98 | 2,100 (2015) | |
| 99 | 2,000 (2015) | |
| 100 | 2,000 | |
| 101 | 1,800 (2015) | |
| 102 | 1,500 (2015) | |
| 103 | 1,200 (2015) | |
| 104 | 1,000 (2015) | |
| 105 | 1,000 (2015) | |
| 106 | 1,000 (2015) | |
| 107 | 900 (2015) | |
| 108 | 700 (2015) | |
| 109 | 300 (2015) | |
| 110 | 300 (2015) | |
| 111 | 200 (2015) | |
| 112 | 200 (2015) | |
| 113 | 200 (2015) | |
| 114 | 200 (2015) | |
| 115 | 100 (2015) | |
| 116 | 100 (2015) | |
| 117 | 100 (2015) |
See also
Notes[5]
- ↑ "The World Factbook: Country Comparison – Crude Oil – Production". CIA. Retrieved 2012-11-20.
- ↑ "Key World Energy Statistics, 2015", IEA, p. 11
- ↑ "Total Petroleum and Other Liquids Production, 2014". U.S. Energy Information Administration. Retrieved 12 September 2015.
- ↑ "World's top oil producers 2016". U.S. Energy Information Administration. Retrieved 05 November 2016. Check date values in:
|access-date=(help) - ↑ "Boletim da Produção de Petróleo e Gás Natural" (PDF).
External links
- International Energy Statistics, US Energy Information Administration