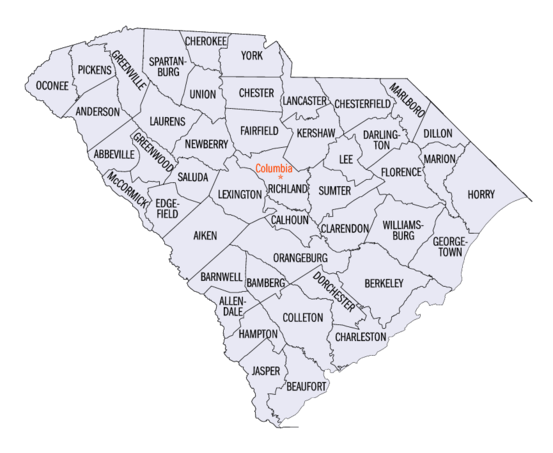
South Carolina statistical areas
The statistical areas of the United States of America comprise the metropolitan statistical areas (MSAs),[1] the micropolitan statistical areas (μSAs),[2] and the combined statistical areas (CSAs)[3] currently defined by the United States Office of Management and Budget (OMB).
Most recently on December 1, 2009, the Office of Management and Budget defined 1067 statistical areas for the United States,[4] including 4 combined statistical areas, 10 metropolitan statistical areas, and 13 micropolitan statistical areas in the State of South Carolina. The table below shows the recent population of these statistical areas and the 46 counties of South Carolina.

Table
The table below describes the 27 United States statistical areas and 46 counties of the State of South Carolina with the following information:[5]
- The combined statistical area (CSA) as designated by the OMB.[6]
- The CSA population as of 2015, as estimated by the United States Census Bureau.[7]
- The core based statistical area (CBSA) as designated by the OMB.[8]
- The CBSA population as of 2015, as estimated by the United States Census Bureau.[6]
- The county name.[9]
- The county population as of 2015, as estimated by the United States Census Bureau.[9]
See also
- State of South Carolina
- Outline of South Carolina
- Index of South Carolina-related articles
- Geography of South Carolina
- Demographics of South Carolina
- South Carolina counties
- South Carolina statistical areas
- Geography of South Carolina
- Demographics of the United States
References
- ↑ The United States Office of Management and Budget (OMB) defines a metropolitan statistical area (MSA) as a core based statistical area having at least one urbanized area of 50,000 or more population, plus adjacent territory that has a high degree of social and economic integration with the core as measured by commuting ties.
- ↑ The United States Office of Management and Budget (OMB) defines a micropolitan statistical area (μSA) as a core based statistical area having at least one urban cluster of at least 10,000 but less than 50,000 population, plus adjacent territory that has a high degree of social and economic integration with the core as measured by commuting ties.
- ↑ The United States Office of Management and Budget (OMB) defines a combined statistical area (CSA) as an aggregate of adjacent core based statistical areas that are linked by commuting ties.
- ↑ "OMB Bulletin No. 10-02: Update of Statistical Area Definitions and Guidance on Their Uses" (PDF). United States Office of Management and Budget. December 1, 2009. Retrieved August 8, 2012.
- ↑ An out-of-state area and its population are displayed in green. An area that extends into more than one state is displayed in teal. A teal population number over a black population number show the total population versus the in-state population.
- 1 2 "OMB Bulletin No. 13-01: Revised Delineations of Metropolitan Statistical Areas, Micropolitan Statistical Areas, and Combined Statistical Areas, and Guidance on Uses of the Delineations of These Areas" (PDF). United States Office of Management and Budget. February 28, 2013. Retrieved March 17, 2013.
- ↑ "Annual Estimates of the Resident Population: April 1, 2010 to July 1, 2015 - United States -- Combined Statistical Area; and for Puerto Rico". United States Census Bureau, Population Division. March 2016. Retrieved October 2, 2016.
- ↑ The United States Office of Management and Budget (OMB) defines a core based statistical area as one or more adjacent counties or county-equivalents having at least one urban cluster of at least 10,000 population, plus adjacent territory that has a high degree of social and economic integration with the core as measured by commuting ties. The core based statistical areas comprise the metropolitan statistical areas and the micropolitan statistical areas.
- 1 2 "Annual Estimates of the Resident Population for Counties and County-Equivalents: April 1, 2000 to July 1, 2006" (CSV). 2006 Population Estimates. United States Census Bureau, Population Division. April 2007. Retrieved August 10, 2012.