Thanet District Council elections
Thanet District Council in Kent, England is elected every four years.
Political control
Since the first election to the council in 1973 political control of the council has been held by the following parties:[1]
| Party in control | Years |
|---|---|
| Conservative | 1973–1987 |
| No overall control | 1987–1991 |
| Conservative | 1991–1995 |
| Labour | 1995–2003 |
| Conservative | 2003–2011 |
| No overall control | 2011–2015 |
| UKIP | 2015–present |
Council elections
- Thanet District Council election, 1973
- Thanet District Council election, 1976
- Thanet District Council election, 1979 (New ward boundaries)[2]
- Thanet District Council election, 1983
- Thanet District Council election, 1987
- Thanet District Council election, 1991
- Thanet District Council election, 1995
- Thanet District Council election, 1999
- Thanet District Council election, 2003 (New ward boundaries increased the number of seats by 2)[3][4]
- Thanet District Council election, 2007
- Thanet District Council election, 2011
- Thanet District Council election, 2015
County result maps
-

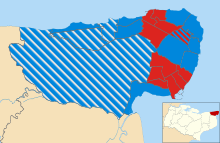
2003 results map
-

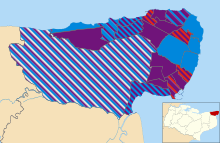
2007 results map
-

2011 results map
-

2015 results map
By-election results
1995–1999
| Party | Candidate | Votes | % | ± | |
|---|---|---|---|---|---|
| Labour | 548 | 43.2 | |||
| Conservative | 338 | 26.6 | |||
| Independent | 187 | 14.7 | |||
| Thanet Socialists | 133 | 10.4 | |||
| Liberal Democrat | 62 | 4.9 | |||
| Majority | 210 | 16.6 | |||
| Turnout | 1,268 | ||||
| Labour hold | Swing | ||||
| Party | Candidate | Votes | % | ± | |
|---|---|---|---|---|---|
| Labour | 164 | 51.3 | -14.6 | ||
| Conservative | 137 | 42.8 | +27.2 | ||
| Liberal Democrat | 19 | 5.9 | +0.8 | ||
| Majority | 27 | 8.5 | |||
| Turnout | 320 | 15.2 | |||
| Labour hold | Swing | -20.9 | |||
1999–2003
| Party | Candidate | Votes | % | ± | |
|---|---|---|---|---|---|
| Conservative | 565 | 72.9 | +34.1 | ||
| Labour | 210 | 27.1 | -10.0 | ||
| Majority | 355 | 45.8 | |||
| Turnout | 775 | 15.5 | |||
| Conservative gain from Labour | Swing | +22.1 | |||
| Party | Candidate | Votes | % | ± | |
|---|---|---|---|---|---|
| Conservative | 858 | 68.9 | +68.9 | ||
| Labour | 388 | 31.1 | -20.4 | ||
| Majority | 470 | 37.8 | |||
| Turnout | 1,246 | 23.1 | |||
| Conservative gain from Labour | Swing | +44.7 | |||
| Party | Candidate | Votes | % | ± | |
|---|---|---|---|---|---|
| Conservative | 1,026 | 60.4 | -0.5 | ||
| Labour | 544 | 32.0 | -7.1 | ||
| Independent | 130 | 7.6 | +7.6 | ||
| Majority | 482 | 28.4 | |||
| Turnout | 1,700 | 27.4 | |||
| Conservative hold | Swing | +3.3 | |||
2003–2007
| Party | Candidate | Votes | % | ± | |
|---|---|---|---|---|---|
| Labour | John Watkins | 370 | 41.0 | -4.8 | |
| Conservative | Ramesh Chhabra | 201 | 22.3 | -23.2 | |
| BNP | Robert Parker | 172 | 19.1 | +19.1 | |
| Liberal Democrat | Guy Voizey | 85 | 9.4 | +9.4 | |
| UKIP | Timothy Stocks | 37 | 4.1 | +4.1 | |
| Socialist Alliance | Karen Cardwell | 19 | 2.1 | +2.1 | |
| Independent | Francis Foy | 18 | 2.0 | -10.7 | |
| Majority | 169 | 18.7 | |||
| Turnout | 902 | 25.9 | |||
| Labour gain from Conservative | Swing | +9.2 | |||
| Party | Candidate | Votes | % | ± | |
|---|---|---|---|---|---|
| Labour | Alan Poole | 378 | 33.2 | -13.3 | |
| Conservative | Robert Burgess | 342 | 30.1 | -6.1 | |
| UKIP | Michael Taylor | 288 | 25.3 | +25.3 | |
| Liberal Democrat | Vincent Knight | 130 | 11.4 | -5.9 | |
| Majority | 36 | 3.1 | |||
| Turnout | 1,138 | 31.1 | |||
| Labour hold | Swing | +3.6 | |||
2007–2011
| Party | Candidate | Votes | % | ± | |
|---|---|---|---|---|---|
| Independent | Bob Grove | 937 | 47.3 | +4.0 | |
| Conservative | Peter Landi | 596 | 30.1 | -6.5 | |
| Liberal Democrat | Louisa Latham | 316 | 15.9 | +15.9 | |
| Labour | Rebecca Scobie | 133 | 6.7 | -13.4 | |
| Majority | 341 | 17.2 | |||
| Turnout | 1,982 | 41.0 | |||
| Independent hold | Swing | +5.3 | |||
| Party | Candidate | Votes | % | ± | |
|---|---|---|---|---|---|
| Labour | Sandra Hart | 318 | 34.2 | -3.9 | |
| Liberal Democrat | Bill Furness | 260 | 28.0 | +28.0 | |
| Conservative | Ingrid Spencer | 222 | 23.9 | -19.7 | |
| Independent | Wendy Allan | 130 | 14.0 | -4.4 | |
| Majority | 58 | 6.2 | |||
| Turnout | 930 | 17.0 | |||
| Labour gain from Conservative | Swing | ||||
References
- ↑ "Thanet". BBC News Online. Retrieved 15 December 2011.
- ↑ The District of Thanet (Electoral Arrangements) Order 1978
- ↑ "Local elections". BBC News Online. Retrieved 2009-12-04.
- ↑ legislation.gov.uk - The District of Thanet (Electoral Changes) Order 2001. Retrieved on 4 October 2015.
- ↑ "Declaration of result of poll" (PDF). Thanet District Council. Retrieved 2009-12-04.
- ↑ "Declaration of result of poll" (PDF). Thanet District Council. Retrieved 2009-12-04.
- ↑ "Local elections round-up". Local Government Association. Retrieved 2009-12-04.
- ↑ "Election results for Thanet Villages Ward". Thanet District Council. Retrieved 2009-12-04.
- ↑ "Labour wins Dane Valley election". this is kent.co.uk. 2009-12-04. Retrieved 2009-12-04.
External links
This article is issued from Wikipedia - version of the 9/14/2016. The text is available under the Creative Commons Attribution/Share Alike but additional terms may apply for the media files.