Arfon (UK Parliament constituency)
| Arfon | |
|---|---|
|
County constituency for the House of Commons | |
|
Boundary of Arfon in Wales for the 2010 general election. | |
| Preserved county | Gwynedd |
| Electorate | 41,138 (December 2010)[1] |
| Major settlements | Bangor, Caernarfon |
| Current constituency | |
| Created | 2010 |
| Member of parliament | Hywel Williams (Plaid Cymru) |
| Number of members | One |
| Created from | Caernarfon and Conwy[2] |
| 1885–1918 | |
| Replaced by | Caernarvonshire |
| Created from | Caernarvonshire |
| Overlaps | |
| Welsh Assembly | Arfon, North Wales |
| European Parliament constituency | Wales |
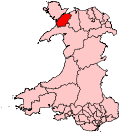
Arfon is a constituency of the House of Commons of the Parliament of the United Kingdom (at Westminster). Although the constituency is relatively large by geographical area, it is a predominantly urban rather than rural seat, with the majority of the population living in the two towns on which the constituency is based, Bangor and Caernarfon. "Arfon" is a historical name for the area, meaning "facing Anglesey"; it is also the name of the former district council. This seat was created by the Welsh Boundary Commission in time for the 2010 general election, and replaced the old seat of Caernarfon. The same boundaries were used for the Arfon Welsh Assembly constituency in the 2007 Welsh Assembly election.
It is the smallest mainland constituency in the UK by electorate, and larger only than the two Scottish island constituencies, Na h-Eileanan an Iar and Orkney and Shetland.
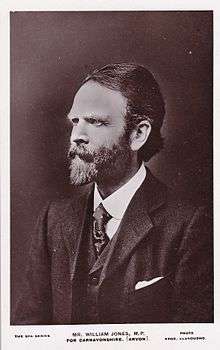
The Arfon division of Caernarvonshire was a former UK Parliament constituency, which existed from 1885 until 1918. Before 1885 and after 1918 the area was part of the Caernarvonshire constituency. The Liberal MP William Rathbone represented the Arfon seat until 1895, followed by fellow Liberal William Jones. Upon the death of Mr Jones, Griffith C. Rees, for the Liberal Party, was elected unopposed at the subsequent by-election.[3]
Boundaries
When first created in 1885, the constituency was defined as the Petty Sessional Divisions of Bangor, Conway and Nant-Conway, with the Parishes of Llanddeinilen and Llanberis (which were within the Carnarvon Petty Sessional Division). The constituency included the boroughs of Bangor and Conway which were part of the Carnarvon District of Boroughs constituency; only those who owned freehold land within the boroughs could vote in elections for the Arfon constituency as a second vote.
The electoral wards which are used to create the twenty-first century Arfon are entirely within the preserved county of Gwynedd. They are Arllechwedd, Bethel, Bontnewydd, Cadnant, Cwm-y-Glo, Deiniol, Deiniolen, Dewi, Garth, Gerlan, Glyder, Groeslon, Hendre, Hirael, Llanberis, Llanllyfni, Llanrug, Llanwnda, Marchog, Menai (Bangor), Menai (Caernarfon), Ogwen, Peblig (Caernarfon), Penisarwaun, Pentir, Penygroes, Seiont, Talysarn, Tregarth and Mynydd Llandygai, Waunfawr and Y Felinheli.
2010 Election
The latest boundary change created a battle ground in Arfon particularly for Labour, Plaid Cymru, and the Conservatives, with the latter being labelled as a ‘resurgent’ party by the Caernarfon Herald.[4] The scale of contention had been reached due to the large shift in boundary changes which in turn has created a need within each party to achieve a relatively unforeseen outcome. Plaid Cymru had previously never represented Bangor, which had been held by Conservative Wyn Roberts for twenty-seven years and a further thirteen under Labour’s Betty Williams. It has however also been more than thirty years since Caernarfon has been represented by anyone other than Plaid Cymru.
Members of Parliament
MPs 1885–1918
| Election | Member[5] | Party | |
|---|---|---|---|
| 1885 | William Rathbone | Liberal | |
| 1895 | William Jones | Liberal | |
| 1915 | Caradoc Rees | Liberal | |
| 1918 | constituency abolished | ||
MPs since 2010
| Election | Member[5] | Party | |
|---|---|---|---|
| 2010 | Hywel Williams | Plaid Cymru | |
Elections
Elections in the 2010s
| Party | Candidate | Votes | % | ± | |
|---|---|---|---|---|---|
| Plaid Cymru | Hywel Williams | 11,790 | 43.9 | +7.9 | |
| Labour | Alun Pugh | 8,122 | 30.3 | -0.1 | |
| Conservative | Anwen Barry [9] | 3,521 | 13.1 | −3.8 | |
| UKIP | Simon Wall[10] | 2,277 | 8.5 | +5.9 | |
| Liberal Democrat | Mohammed Shultan | 718 | 2.7 | -11.4 | |
| Socialist Labour | Kathrine Jones | 409 | 1.5 | n/a | |
| Majority | 3,668 | 13.7 | +8.1 | ||
| Turnout | 26,837 | 66.3 | +3.0 | ||
| Plaid Cymru hold | Swing | +4.0 | |||
| Party | Candidate | Votes | % | ± | |
|---|---|---|---|---|---|
| Plaid Cymru | Hywel Williams* | 9,383 | 36.0 | +3.9 | |
| Labour | Alun Pugh | 7,928 | 30.4 | −3.5 | |
| Conservative | Robin Millar | 4,416 | 16.9 | +0.5 | |
| Liberal Democrat | Sarah Green | 3,666 | 14.1 | −1.7 | |
| UKIP | Elwyn Williams | 685 | 2.6 | +0.7 | |
| Majority | 1,455 | 5.6 | +7.4 | ||
| Turnout | 26,078 | 63.3 | +5.1 | ||
| Plaid Cymru gain from Labour | Swing | +3.7 | |||
*Served as MP for the predecessor seat of Caernarfon in the 2005-2010 Parliament
Elections 1885-1918
Elections in the 1880s
| Party | Candidate | Votes | % | ± | |
|---|---|---|---|---|---|
| Liberal | William Rathbone | 4,562 | 61.6 | n/a | |
| Conservative | Henry Platt | 2,838 | 38.4 | n/a | |
| Majority | 1,724 | 23.2 | n/a | ||
| Turnout | 81.0 | n/a | |||
| Liberal win (new seat) | |||||
| Party | Candidate | Votes | % | ± | |
|---|---|---|---|---|---|
| Liberal | William Rathbone | 4,072 | 58.0 | -3.6 | |
| Conservative | Henry Platt | 2,950 | 42.0 | +3.6 | |
| Majority | 1,122 | 16.0 | -7.2 | ||
| Turnout | 76.9 | -4.1 | |||
| Liberal hold | Swing | ||||
Elections in the 1890s
| Party | Candidate | Votes | % | ± | |
|---|---|---|---|---|---|
| Liberal | William Rathbone | unopposed | n/a | n/a | |
| Liberal hold | Swing | n/a | |||
| Party | Candidate | Votes | % | ± | |
|---|---|---|---|---|---|
| Liberal | William Jones | 4,488 | 61.1 | n/a | |
| Conservative | Alfred William Hughes | 2,860 | 38.9 | n/a | |
| Majority | 1,628 | 22.2 | n/a | ||
| Turnout | 83.3 | n/a | |||
| Liberal hold | Swing | n/a | |||
Elections in the 1900s
| Party | Candidate | Votes | % | ± | |
|---|---|---|---|---|---|
| Liberal | William Jones | unopposed | n/a | n/a | |
| Liberal hold | Swing | n/a | |||
| Party | Candidate | Votes | % | ± | |
|---|---|---|---|---|---|
| Liberal | William Jones | 5,945 | 70.1 | n/a | |
| Conservative | Arthur E Hughes | 2,533 | 29.9 | n/a | |
| Majority | 3,412 | 40.2 | n/a | ||
| Turnout | 85.2 | n/a | |||
| Liberal hold | Swing | n/a | |||
Elections in the 1910s
| Party | Candidate | Votes | % | ± | |
|---|---|---|---|---|---|
| Liberal | William Jones | 6,223 | 70.3 | ||
| Conservative | Arthur E Hughes | 2,629 | 29.7 | ||
| Majority | 3,594 | 40.6 | |||
| Turnout | |||||
| Liberal hold | Swing | ||||
| Party | Candidate | Votes | % | ± | |
|---|---|---|---|---|---|
| Liberal | William Jones | unopposed | n/a | n/a | |
| Liberal hold | Swing | n/a | |||
| Party | Candidate | Votes | % | ± | |
|---|---|---|---|---|---|
| Liberal | William Jones | unopposed | n/a | n/a | |
| Liberal hold | Swing | n/a | |||
| Party | Candidate | Votes | % | ± | |
|---|---|---|---|---|---|
| Liberal | Griffith Caradoc Rees | unopposed | n/a | n/a | |
| Liberal hold | Swing | n/a | |||
See also
Notes and references
- ↑ "Beyond 20/20 WDS - Table view". 2011 Electorate Figures. StatsWales. 1 December 2010. Retrieved 13 March 2011.
- ↑ "Arfon' UK Parliament, 6 May 2010 -". ElectionWeb Project. Cognitive Computing Limited. Retrieved 31 March 2016.
- ↑ Information in the paragraph is taken in part from F.W.S Craig's British Parliamentary Election Results 1885-1918 (Macmillan, 1974).
- ↑ "Caernarfon Herald". Caernarfon Herald. Archived from the original on 13 April 2010. Retrieved 11 April 2010.
- 1 2 Leigh Rayment's Historical List of MPs – Constituencies beginning with "A" (part 2)
- ↑ "Gwynedd Council results". Parliamentary Election results - 7 May 2015. Gwynedd Council. Retrieved 20 September 2015.
- ↑ total electorate 40,492 email from Gwynedd Council 3Jun15
- ↑ "UK ELECTION RESULTS". Retrieved 25 April 2016.
- ↑ "Archived copy". Archived from the original on 2015-01-19. Retrieved 2015-01-19.
- ↑ "UK Polling Report". Retrieved 25 April 2016.
- ↑ "BBC News - Election 2010 - Constituency - Arfon". Retrieved 25 April 2016.
- 1 2 3 4 5 6 7 8 9 10 British parliamentary election results, 1885-1918 (Craig)
Further reading
- Boundaries of Parliamentary Constituencies 1885-1972, compiled and edited by F.W.S. Craig (Political Reference Publications 1972)
