Gosport (UK Parliament constituency)
| Gosport | |
|---|---|
|
Borough constituency for the House of Commons | |
|
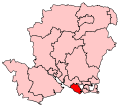
Boundary of Gosport in Hampshire. | |
|
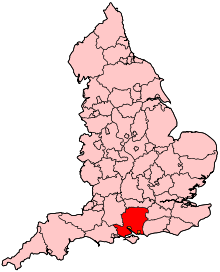
Location of Hampshire within England. | |
| County | Hampshire |
| Electorate | 72,845 (December 2010)[1] |
| Current constituency | |
| Created | 1974 |
| Member of parliament | Caroline Dinenage (Conservative) |
| Number of members | One |
| Created from | Gosport & Fareham |
| Overlaps | |
| European Parliament constituency | South East England |
Gosport /ˈɡɒspɔːrt/ is a constituency[n 1] represented in the House of Commons of the UK Parliament since 2010 by Caroline Dinenage of the Conservative Party.[n 2]
Boundaries
1974-1983: The Municipal Borough of Gosport.
1983-present: The Borough of Gosport, and the Borough of Fareham wards of Hill Head and Stubbington.
The constituency centres on Peel Common, Chalk Common and the River Alver that run north-south — its largest settlement is arguably the eastern town of Gosport. Gosport post town comprises several distinct villages and neighbourhoods on the south coast of England in Hampshire whereas the constituency comprises the whole of Gosport Borough (including Lee-on-the-Solent and Alverstoke) and includes Stubbington and Hill Head from the neighbouring Fareham Borough.
Constituency profile
Gosport has to date been a Conservative safe seat - an area with a majority of privately owned properties that has a minority of poor residents — two large housing estates in the south and east of Rowner for example are according to the 2001 census predominantly social housing and contain two of the most deprived output areas in terms of income and unemployment in the United Kingdom however is not of uniform characterisation.[2][3] Rowner has a central conservation area of expensive housing and touches immediately to the west the Lee on Solent Golf Club, Grange Farm Museum, the West of the Alder Nature Reserve and the Wild Grounds Nature reserve. Beside its bowling green, allotments and recreation ground lies Grade I-architecture St Mary's Church.[4] Unlike the generally expensive west of the borough,[3] Rowner resembles central Gosport and Bridgemary in presenting a diverse picture retaining scenic and generally more rural surroundings than the City of Portsmouth with some areas of deprivation.[5]
History
The constituency was created for the February 1974 general election. The area had previously been part of the constituency of Gosport and Fareham.
In December 2009, Gosport became the second constituency to vote in an open primary to select the Conservative PPC. All residents of the area were asked to take part via a postal vote. The result of the Gosport primary saw Caroline Dinenage publicly selected. At the general election on 6 May 2010, Caroline Dinenage was elected with 24,300 votes, a majority of 14,413 votes. Dinenage is currently Minister for Equalities. Since the turn of the century Labour, UKIP and the Liberal Democrats have also finished second.
Peter Viggers (later knighted) had represented the constituency from 1974 to 2010. David Cameron instructed Sir Peter not to stand for re-election after his nationally infamous attempt to claim for a duck house during the MPs' expenses scandal.
Members of Parliament
| Election | Member [6] | Party | |
|---|---|---|---|
| Feb 1974 | Sir Peter Viggers | Conservative | |
| 2010 | Caroline Dinenage | Conservative | |
Elections
Elections in the 2010s
| Party | Candidate | Votes | % | ± | |
|---|---|---|---|---|---|
| Conservative | Caroline Dinenage | 26,364 | 55.3 | +3.5 | |
| UKIP | Christopher Wood | 9,266 | 19.4 | +16.3 | |
| Labour | Alan Durrant | 6,926 | 14.5 | −2.4 | |
| Liberal Democrat | Rob Hylands[9] | 3,298 | 6.9 | -14.1 | |
| Green | Monica Cassidy | 1,707 | 3.6 | +2.4 | |
| Independent | Jeffrey Roberts | 104 | 0.2 | N/A | |
| Majority | 17,098 | 35.9 | +5.2 | ||
| Turnout | 47,662 | 65.1 | +0.5 | ||
| Conservative hold | Swing | ||||
| Party | Candidate | Votes | % | ± | |
|---|---|---|---|---|---|
| Conservative | Caroline Dinenage | 24,300 | 51.8 | +7.0 | |
| Liberal Democrat | Rob Hylands | 9,887 | 21.1 | +4.5 | |
| Labour | Graham Giles | 7,944 | 15.9 | −14.5 | |
| UKIP | Andrew Rice | 1,496 | 3.2 | −1.1 | |
| BNP | Barry Bennett | 1,004 | 2.1 | +2.1 | |
| English Democrat | Bob Shaw | 622 | 1.3 | +1.3 | |
| Green | Claire Smith | 573 | 1.2 | -1.7 | |
| Independent | Dave Smith | 493 | 1.1 | +1.1 | |
| Independent | Charlie Read | 331 | 0.7 | +0.7 | |
| Independent | Brian Hart | 289 | 0.6 | +0.6 | |
| Majority | 14,413 | 30.7 | |||
| Turnout | 46,939 | 64.6 | +3.3 | ||
| Conservative hold | Swing | +1.3 | |||
Elections in the 2000s
| Party | Candidate | Votes | % | ± | |
|---|---|---|---|---|---|
| Conservative | Peter Viggers | 19,268 | 44.8 | +1.2 | |
| Labour | Richard Williams | 13,538 | 31.5 | −5.6 | |
| Liberal Democrat | Roger Roberts | 7,145 | 16.6 | +1.5 | |
| UKIP | John Bowles | 1,825 | 4.2 | +1.3 | |
| Green | Claire Smith | 1,258 | 2.9 | +2.9 | |
| Majority | 5,730 | 13.3 | |||
| Turnout | 43,034 | 60.5 | 3.4 | ||
| Conservative hold | Swing | +3.4 | |||
| Party | Candidate | Votes | % | ± | |
|---|---|---|---|---|---|
| Conservative | Peter Viggers | 17,364 | 43.6 | ± | |
| Labour | Richard Williams | 14,743 | 37.1 | +6.4 | |
| Liberal Democrat | Roger Roberts | 6,011 | 15.1 | −4.5 | |
| UKIP | John Bowles | 1,162 | 2.9 | N/A | |
| Socialist Labour | Kevin Chetwynd | 509 | 1.3 | N/A | |
| Majority | 2,621 | 6.5 | |||
| Turnout | 39,789 | 57.1 | -13.1 | ||
| Conservative hold | Swing | -3.2 | |||
Elections in the 1990s
| Party | Candidate | Votes | % | ± | |
|---|---|---|---|---|---|
| Conservative | Peter Viggers | 21,085 | 43.61 | ||
| Labour | Ivan Gray | 14,827 | 30.66 | ||
| Liberal Democrat | Steve Hogg | 9,479 | 19.60 | ||
| Referendum | Andrew Blowers | 2,538 | 5.25 | ||
| Independent | Patrick Ettie | 426 | 0.88 | ||
| Majority | 6,258 | 12.94 | |||
| Turnout | 48,355 | 70.25 | |||
| Conservative hold | Swing | ||||
| Party | Candidate | Votes | % | ± | |
|---|---|---|---|---|---|
| Conservative | Peter Viggers | 31,094 | 58.1 | −0.4 | |
| Liberal Democrat | MG Russell | 14,776 | 27.6 | −3.9 | |
| Labour | Mrs MF Angus | 7,275 | 13.6 | +3.7 | |
| Independent | PFF Ettie | 332 | 0.6 | +0.6 | |
| Majority | 16,318 | 30.5 | +3.6 | ||
| Turnout | 53,477 | 76.6 | +1.8 | ||
| Conservative hold | Swing | +1.8 | |||
Elections in the 1980s
| Party | Candidate | Votes | % | ± | |
|---|---|---|---|---|---|
| Conservative | Peter Viggers | 29,804 | 58.51 | ||
| Liberal | P.J. Chegwyn | 16,081 | 31.57 | ||
| Labour | A. Lloyd | 5,053 | 9.92 | ||
| Majority | 13,723 | 26.94 | |||
| Turnout | 74.78 | ||||
| Conservative hold | Swing | ||||
| Party | Candidate | Votes | % | ± | |
|---|---|---|---|---|---|
| Conservative | Peter Viggers | 28,179 | 60.64 | ||
| Liberal | P. Chegwyn | 13,728 | 29.54 | ||
| Labour | B.B. Bond | 4,319 | 9.29 | ||
| Independent | R.A. MacMillan | 241 | 0.52 | ||
| Majority | 14,451 | 31.10 | |||
| Turnout | 71.62 | ||||
| Conservative hold | Swing | ||||
Elections in the 1970s
| Party | Candidate | Votes | % | ± | |
|---|---|---|---|---|---|
| Conservative | Peter Viggers | 24,553 | 61.76 | ||
| Labour | J.A. Slater | 10,460 | 26.31 | ||
| Liberal | C. Lewis | 4,741 | 11.93 | ||
| Majority | 14,093 | 35.45 | |||
| Turnout | 77.47 | ||||
| Conservative hold | Swing | ||||
| Party | Candidate | Votes | % | ± | |
|---|---|---|---|---|---|
| Conservative | Peter Viggers | 17,487 | 47.51 | ||
| Labour | Peter Marsh Tebutt | 10,621 | 28.85 | ||
| Liberal | Peter Dane Clark | 8,701 | 23.64 | ||
| Majority | 6,866 | 18.65 | |||
| Turnout | 75.32 | ||||
| Conservative hold | Swing | ||||
| Party | Candidate | Votes | % | ± | |
|---|---|---|---|---|---|
| Conservative | Peter Viggers | 19,563 | 49.7 | N/A | |
| Labour | Graham John Hewitt | 12,335 | 31.3 | N/A | |
| Liberal | John George Rodway Rix | 7,485 | 19.0 | N/A | |
| Majority | 7,228 | 18.4 | N/A | ||
| Turnout | 81.36 | N/A | |||
| Conservative win (new seat) | |||||
See also
Notes and references
- Notes
- ↑ A borough constituency (for the purposes of election expenses and type of returning officer)
- ↑ As with all constituencies, the constituency elects one Member of Parliament (MP) by the first past the post system of election at least every five years.
- References
- ↑ "Electorate Figures - Boundary Commission for England". 2011 Electorate Figures. Boundary Commission for England. 4 March 2011. Retrieved 13 March 2011.
- ↑ 2001 census statistics
- 1 2 Local House Price Map - Mouseprice.com
- ↑ Historic England. "Details from listed building database (1276419)". National Heritage List for England.
- ↑ Ordnance survey website
- ↑ Leigh Rayment's Historical List of MPs – Constituencies beginning with "G" (part 2)
- ↑ "Election Data 2015". Electoral Calculus. Archived from the original on 17 October 2015. Retrieved 17 October 2015.
- ↑ "County councillor stands against Tory MP". Portsmouth.co.uk. Retrieved 2014-02-14.
- ↑ http://www.libdems.org.uk/general_election_candidates#South East
- ↑ "Election Data 2010". Electoral Calculus. Archived from the original on 17 October 2015. Retrieved 17 October 2015.
- ↑ "Election Data 2005". Electoral Calculus. Archived from the original on 15 October 2011. Retrieved 18 October 2015.
- ↑ "Election Data 2001". Electoral Calculus. Archived from the original on 15 October 2011. Retrieved 18 October 2015.
- ↑ "Election Data 1997". Electoral Calculus. Archived from the original on 15 October 2011. Retrieved 18 October 2015.
- ↑ "Election Data 1992". Electoral Calculus. Archived from the original on 15 October 2011. Retrieved 18 October 2015.
- ↑ "Politics Resources". Election 1992. Politics Resources. 9 April 1992. Retrieved 2010-12-06.
- ↑ "Election Data 1987". Electoral Calculus. Archived from the original on 15 October 2011. Retrieved 18 October 2015.
- ↑ "Election Data 1983". Electoral Calculus. Archived from the original on 15 October 2011. Retrieved 18 October 2015.
Coordinates: 50°48′N 1°10′W / 50.80°N 1.17°W


