Lincoln (UK Parliament constituency)
Lincoln | |
---|---|
Borough constituency for the House of Commons | |
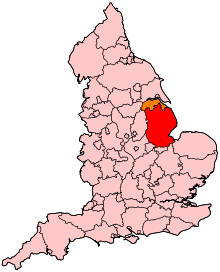
Boundary of Lincoln in Lincolnshire. | |
Location of Lincolnshire within England. | |
County | Lincolnshire |
Electorate | 72,662 (December 2010)[1] |
Major settlements | Lincoln |
Current constituency | |
Created | 1265 |
Member of parliament | Karl McCartney (Conservative) |
Number of members | Two until 1885, then one |
Overlaps | |
European Parliament constituency | East Midlands |
Lincoln is a constituency[n 1] represented in the House of Commons of the UK Parliament since 2010 by Karl McCartney, a Conservative.[n 2]
With the splitting of the City of York constituency at the 2010 general election, Lincoln became the oldest constituency in continuous existence in the United Kingdom, having been established in 1265.
Boundaries
The constituency, as its name suggests, covers the cathedral city[n 3] of Lincoln in Lincolnshire, and most of its directly adjoining villages.
History
Lincoln first sent Members to Parliament in 1265, thirty years before the first all-over coverage of cities and qualifying towns was introduced in the Model Parliament, and has done so ever since, although no records exist from before the end of the 13th century. The early elections were held at the Guildhall and the burgesses elected were usually officials of the borough.
The representation, originally two Members ("burgesses"), was reduced to one Member in 1885.
The seat was represented for five years by the future Cabinet minister Margaret Jackson, later Margaret Beckett.[n 4] Lincoln became the oldest constituency in the country in 2010 when the City of York constituency was divided.
Constituency profile
The seat includes the University of Lincoln. From 1945 to 1972 Lincoln was continuously held by the Labour Party, often as a safe seat. The city has good transport links with Nottingham, Hull and the smaller ancient market towns in Lincolnshire, such as Spalding, Market Rasen and Boston. Lincoln has been a bellwether constituency since October 1974, having voted for the winning party in each election since that time.
Members of Parliament
MPs 1265–1660
MPs 1660–1885
MPs 1885–present
Election | Member[8] | Party | |
---|---|---|---|
1885 | Joseph Ruston | Liberal | |
1886 | Liberal Unionist | ||
1886 | Frederick Harold Kerans | Conservative | |
1892 | William Crosfield | Liberal | |
1895 | Charles Hilton Seely | Liberal Unionist | |
1906 | Charles Henry Roberts | Liberal | |
1918 | Alfred Thomas Davies | Coalition Conservative | |
1924 | Robert Arthur Taylor | Labour | |
1931 | Walter Sydney Liddall | Conservative | |
1945 | George Deer | Labour | |
1950 | Geoffrey de Freitas | Labour | |
1962 by-election | Dick Taverne | Labour (until 1972)
Lincoln Democratic Labour (from 1973) | |
1973 by-election | |||
Oct 1974 | Margaret Jackson later Beckett | Labour | |
1979 | Kenneth Carlisle | Conservative | |
1997 | Gillian Merron | Labour | |
2010 | Karl McCartney | Conservative |
Elections
Elections in the 2010s
Party | Candidate | Votes | % | ± | |
---|---|---|---|---|---|
Conservative | Karl McCartney | 19,976 | 42.6 | +5.1 | |
Labour | Lucy Rigby | 18,533 | 39.6 | +4.3 | |
UKIP | Nick Smith | 5,721 | 12.2 | +10.0 | |
Liberal Democrat | Ross Pepper | 1,992 | 4.3 | -16.0 | |
TUSC | Elaine Smith | 344 | 0.7 | +0.7 | |
Lincolnshire Independent | Helen Powell | 286 | 0.6 | +0.6 | |
Majority | 1,443 | 3.1 | |||
Turnout | 46,852 | 63.2 | |||
Conservative hold | Swing | ||||
Party | Candidate | Votes | % | ± | |
---|---|---|---|---|---|
Conservative | Karl McCartney | 17,163 | 37.5 | +4.6 | |
Labour | Gillian Merron | 16,105 | 35.2 | −10.2 | |
Liberal Democrat | Reg Shore | 9,256 | 20.2 | +2.0 | |
BNP | Robert West | 1,367 | 3.0 | N/A | |
UKIP | Nick Smith | 1,004 | 2.2 | −1.3 | |
English Democrat | Ernest Coleman | 604 | 1.3 | N/A | |
Independent | Gary Walker | 222 | 0.5 | N/A | |
Majority | 1,058 | 2.3 | |||
Turnout | 45,721 | 62.2 | +4.9 | ||
Conservative gain from Labour | Swing | 6.75 | |||
Elections in the 2000s
Party | Candidate | Votes | % | ± | |
---|---|---|---|---|---|
Labour | Gillian Merron | 16,724 | 45.4 | −8.5 | |
Conservative | Karl McCartney | 12,110 | 32.9 | +1.7 | |
Liberal Democrat | Lisa Gabriel | 6,715 | 18.2 | +5.5 | |
UKIP | Nicholas Smith | 1,308 | 3.5 | +1.2 | |
Majority | 4,613 | 12.5 | |||
Turnout | 36,856 | 56.5 | +0.5 | ||
Labour hold | Swing | 5.1 | |||
Party | Candidate | Votes | % | ± | |
---|---|---|---|---|---|
Labour | Gillian Merron | 20,003 | 53.9 | −1.0 | |
Conservative | Christine-Anne Talbot | 11,583 | 31.2 | +0.2 | |
Liberal Democrat | Lisa Gabriel | 4,703 | 12.7 | +1.8 | |
UKIP | Rodger Doughty | 836 | 2.3 | N/A | |
Majority | 8,420 | 22.7 | |||
Turnout | 37,125 | 56.0 | −15.0 | ||
Labour hold | Swing | ||||
Elections in the 1990s
Party | Candidate | Votes | % | ± | |
---|---|---|---|---|---|
Labour | Gillian Merron | 25,563 | 54.9 | ||
Conservative | Tony Brown | 14,433 | 31.0 | ||
Liberal Democrat | Lisa Gabriel | 5,048 | 10.8 | ||
Referendum | John Ivory | 1,329 | 2.9 | ||
Natural Law | Adrian Myers | 175 | 0.4 | ||
Majority | 11,130 | ||||
Turnout | 71.1 | ||||
Labour gain from Conservative | Swing | ||||
Party | Candidate | Votes | % | ± | |
---|---|---|---|---|---|
Conservative | Kenneth Carlisle | 28,792 | 46.1 | −0.4 | |
Labour | Nick Butler | 26,743 | 42.8 | +9.2 | |
Liberal Democrat | David Harding-Price | 6,316 | 10.1 | −9.3 | |
Liberal | Mrs Sue E. Wiggin | 603 | 1.0 | +1.0 | |
Majority | 2,049 | 3.3 | −9.6 | ||
Turnout | 62,454 | 79.1 | +3.5 | ||
Conservative hold | Swing | −4.8 | |||
Elections in the 1980s
Party | Candidate | Votes | % | ± | |
---|---|---|---|---|---|
Conservative | Kenneth Carlisle | 27,097 | 46.5 | ||
Labour | Nick Butler | 19,614 | 33.7 | ||
Social Democratic | Peter Zentner | 6,316 | 10.1 | ||
RRPRC | Thomas Beaton Kyle | 232 | 0.4 | ||
Majority | 7,483 | 12.8 | |||
Turnout | 75.6 | ||||
Conservative hold | Swing | ||||
Party | Candidate | Votes | % | ± | |
---|---|---|---|---|---|
Conservative | Kenneth Carlisle | 25,244 | 46.4 | ||
Labour | Malcolm Withers | 14,958 | 27.5 | ||
Social Democratic | Frederick Stockdale | 13,631 | 25.1 | ||
Independent | Gilbert Blades | 523 | 1.0 | ||
Majority | 10,286 | 18.9 | |||
Turnout | 74.6 | ||||
Conservative hold | Swing | ||||
Elections in the 1970s
Party | Candidate | Votes | % | ± | |
---|---|---|---|---|---|
Conservative | Kenneth Carlisle | 17,777 | 41.8 | ||
Labour | Margaret Mary Jackson | 17,175 | 40.4 | ||
Liberal | K. Melton | 5,638 | 13.3 | ||
Democratic Labour | Frederick Stockdale | 1,743 | 4.1 | ||
National Front | J. Noble | 523 | 1.0 | ||
Revolutionary Reform | T. Kyle | 77 | 0.2 | ||
Majority | 602 | 1.4 | |||
Turnout | 77.0 | ||||
Conservative gain from Labour | Swing | ||||
Party | Candidate | Votes | % | ± | |
---|---|---|---|---|---|
Labour | Margaret Mary Jackson | 14,698 | 37.1 | ||
Democratic Labour | Dick Taverne | 13,714 | 34.6 | ||
Conservative | Peter Miles Moran | 11,223 | 28.3 | ||
Majority | 984 | 2.5 | |||
Turnout | 74.8 | ||||
Labour gain from Democratic Labour | Swing | ||||
Party | Candidate | Votes | % | ± | |
---|---|---|---|---|---|
Democratic Labour | Dick Taverne | 14,780 | 35.6 | ||
Labour | Margaret Mary Jackson | 13,487 | 32.5 | ||
Conservative | Paul Miles Moran | 13,299 | 32.0 | ||
Majority | 1,293 | 3.1 | |||
Turnout | 79.1 | ||||
Democratic Labour hold | Swing | ||||
Party | Candidate | Votes | % | ± | |
---|---|---|---|---|---|
Democratic Labour | Dick Taverne | 21,967 | 58.2 | +58.2 | |
Labour | John Dilks | 8,776 | 23.2 | -27.7 | |
Conservative | Jonathan Bryan Guinness | 6,616 | 17.5 | -21.5 | |
Democratic Conservative | Reginald Simmerson | 198 | 0.5 | ||
Majority Rule | Malcolm Waller | 100 | 0.3 | ||
Independent | Jean Justice | 81 | 0.2 | ||
Majority | 13,191 | 34.9 | |||
Turnout | 37,738 | 72.6 | |||
Democratic Labour gain from Labour | Swing | ||||
Party | Candidate | Votes | % | ± | |
---|---|---|---|---|---|
Labour | Dick Taverne | 20,090 | 51.0 | ||
Conservative | Richard Thain Alexander | 15,340 | 39.0 | ||
Independent Liberal | Gilbert Blades | 3,937 | 10.0 | ||
Majority | 4,750 | 12.1 | |||
Turnout | 74.4 | ||||
Labour hold | Swing | ||||
Elections in the 1960s
Party | Candidate | Votes | % | ± | |
---|---|---|---|---|---|
Labour | Dick Taverne | 23,006 | 58.3 | ||
Conservative | Richard Thain Alexander | 16,469 | 41.7 | ||
Majority | 6,537 | 16.6 | |||
Turnout | 78.7 | ||||
Labour hold | Swing | ||||
Party | Candidate | Votes | % | ± | |
---|---|---|---|---|---|
Labour | Dick Taverne | 19,737 | 47.8 | ||
Conservative | Robert Michael Conal McNair-Wilson | 15,015 | 36.4 | ||
Liberal | Patrick Arthur Thomas Furnell | 6,519 | 15.8 | ||
Majority | 4,722 | 11.4 | |||
Turnout | 80.3 | ||||
Labour hold | Swing | ||||
Party | Candidate | Votes | % | ± | |
---|---|---|---|---|---|
Labour | Dick Taverne | 19,038 | 50.51 | ||
Conservative | William Percival Grieve | 11,386 | 30.21 | ||
Liberal | Patrick Arthur Thomas Furnell | 6,856 | 18.19 | ||
Independent | Capt. A. Taylor | 412 | 1.09 | ||
Majority | 7,652 | 20.30 | |||
Turnout | 37,692 | ||||
Labour hold | Swing | ||||
Elections in the 1950s
Party | Candidate | Votes | % | ± | |
---|---|---|---|---|---|
Labour | Geoffrey Stanley de Freitas | 23,629 | 55.1 | ||
Conservative | Leslie Herbert Priestley | 19,240 | 44.9 | ||
Majority | 4,389 | 10.2 | |||
Turnout | 84.1 | ||||
Labour hold | Swing | ||||
Party | Candidate | Votes | % | ± | |
---|---|---|---|---|---|
Labour | Geoffrey Stanley de Freitas | 23,773 | 56.2 | ||
Conservative | Peter Frank Hannibal Emery | 18,551 | 43.8 | ||
Majority | 5,222 | 12.3 | |||
Turnout | 85.9 | ||||
Labour hold | Swing | ||||
Party | Candidate | Votes | % | ± | |
---|---|---|---|---|---|
Labour | Geoffrey Stanley de Freitas | 23,400 | 54.1 | ||
Conservative | Maurice Victor Macmillan | 19,840 | 45.9 | ||
Majority | 3,560 | 8.2 | |||
Turnout | 87.8 | ||||
Labour hold | Swing | ||||
Party | Candidate | Votes | % | ± | |
---|---|---|---|---|---|
Labour | Geoffrey Stanley de Freitas | 21,537 | 50.0 | ||
Conservative | James William Francis Hill | 17,784 | 41.3 | ||
Liberal | Jean Mary Henderson | 3,753 | 8.7 | ||
Majority | 3,753 | 8.7 | |||
Turnout | 88.7 | ||||
Labour hold | Swing | ||||
Election in the 1940s
Party | Candidate | Votes | % | ± | |
---|---|---|---|---|---|
Labour | George Deer | 14,052 | 41.3 | -4.7 | |
Conservative | Sir Walter Sydney Liddall | 10,414 | 30.5 | -23.5 | |
Liberal | Frederick Charles Truman | 9,625 | 28.2 | n/a | |
Majority | 3,638 | 10.8 | 18.8 | ||
Turnout | 80.3 | -3.7 | |||
Labour gain from Conservative | Swing | +9.4 | |||
General Election 1939/40
Another General Election was required to take place before the end of 1940. The political parties had been making preparations for an election to take place from 1939 and by the end of this year, the following candidates had been selected;
- Conservative: Sir Walter Sydney Liddall
- Labour: George Deer
- Liberal:
- British Union: E. H. Adams
Elections in the 1930s
Party | Candidate | Votes | % | ± | |
---|---|---|---|---|---|
Conservative | Walter Sydney Liddall | 17,948 | 54.0 | -4.9 | |
Labour | George Deer | 15,264 | 46.0 | +4.9 | |
Majority | 2,684 | 8.0 | -9.8 | ||
Turnout | 84.0 | -4.9 | |||
Conservative hold | Swing | -4.9 | |||
Party | Candidate | Votes | % | ± | |
---|---|---|---|---|---|
Conservative | Walter Sydney Liddall | 20,688 | 58.9 | +24.6 | |
Labour | Robert Arthur Taylor | 14,455 | 41.1 | -2.5 | |
Majority | 6,233 | 17.8 | 27.1 | ||
Turnout | 88.9 | +0.4 | |||
Conservative gain from Labour | Swing | +13.5 | |||
Elections in the 1920s
Party | Candidate | Votes | % | ± | |
---|---|---|---|---|---|
Labour | Robert Arthur Taylor | 15,176 | 43.6 | +2.3 | |
Unionist | Benjamin Garnet Lampard-Vachell | 11,978 | 34.3 | -6.8 | |
Liberal | Robert Pattinson | 7,719 | 22.1 | +4.5 | |
Majority | 3,198 | 9.3 | +9.1 | ||
Turnout | 88.5 | 0.0 | |||
Labour hold | Swing | +4.5 | |||
Party | Candidate | Votes | % | ± | |
---|---|---|---|---|---|
Labour | Robert Arthur Taylor | 11,596 | 41.3 | +7.1 | |
Unionist | Sir Collingwood George Clements Hamilton | 11,557 | 41.1 | -0.9 | |
Liberal | Archibald Gordon Macdonell | 4,952 | 17.6 | -6.2 | |
Majority | 39 | 0.2 | 8.0 | ||
Turnout | 88.5 | +3.0 | |||
Labour gain from Unionist | Swing | +4.0 | |||
Party | Candidate | Votes | % | ± | |
---|---|---|---|---|---|
Unionist | Alfred Thomas Davies | 11,338 | 42.0 | -17.0 | |
Labour | Robert Arthur Taylor | 9,251 | 34.2 | -6.8 | |
Liberal | Archibald Gordon Macdonell | 6,447 | 23.8 | n/a | |
Majority | 2,087 | 7.8 | -10.2 | ||
Turnout | 85.5 | -0.4 | |||
Unionist hold | Swing | -5.1 | |||
Party | Candidate | Votes | % | ± | |
---|---|---|---|---|---|
Unionist | Alfred Thomas Davies | 15,780 | 59.0 | +11.3 | |
Labour | Robert Arthur Taylor | 10,951 | 41.0 | +12.5 | |
Majority | 4,829 | 18.0 | -1.2 | ||
Turnout | 85.9 | +11.5 | |||
Unionist hold | Swing | -0.6 | |||
Elections in the 1910s
Party | Candidate | Votes | % | ± | |
---|---|---|---|---|---|
Unionist | *Alfred Thomas Davies | 11,114 | 47.7 | +0.6 | |
Labour | Robert Arthur Taylor | 6,658 | 28.5 | n/a | |
Liberal | Charles Henry Roberts | 5,550 | 23.8 | -29.1 | |
Majority | 4,456 | 19.2 | 25.0 | ||
Turnout | 74.4 | ||||
Unionist gain from Liberal | Swing | +14.8 | |||
*endorsed by Coalition Government
General Election 1914/15
Another General Election was required to take place before the end of 1915. The political parties had been making preparations for an election to take place and by the July 1914, the following candidates had been selected;
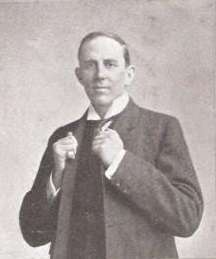
- Liberal: Charles Henry Roberts
- Unionist: J. Foster
Party | Candidate | Votes | % | ± | |
---|---|---|---|---|---|
Liberal | Charles Henry Roberts | 5,484 | 52.9 | +2.7 | |
Conservative | Sir Robert Marcus Filmer | 4,878 | 47.1 | +17.0 | |
Majority | 606 | 5.8 | -14.3 | ||
Turnout | 10,362 | ||||
Liberal hold | Swing | -7.1 | |||
Party | Candidate | Votes | % | ± | |
---|---|---|---|---|---|
Liberal | Charles Henry Roberts | 5,402 | 50.2 | -1.0 | |
Conservative | Sir Robert Marcus Filmer | 3,236 | 30.1 | +18.5 | |
Ind. Liberal Unionist | 2,129 | 19.8 | -17.4 | ||
Majority | 2,166 | 20.1 | +6.1 | ||
Turnout | 10,767 | ||||
Liberal hold | Swing | ||||
- supported Free Trade
Elections in the 1900s
Party | Candidate | Votes | % | ± | |
---|---|---|---|---|---|
Liberal | Charles Henry Roberts | 5,110 | 51.2 | +1.6 | |
Ind. Liberal Unionist | 3,718 | 37.2 | -13.2 | ||
Conservative | Henry Page Croft | 1,162 | 11.6 | n/a | |
Majority | 1,392 | 14.0 | 14.8 | ||
Turnout | 93.8 | ||||
Liberal gain from Liberal Unionist | Swing | +7.4 | |||
- supported Free Trade
Party | Candidate | Votes | % | ± | |
---|---|---|---|---|---|
Liberal Unionist | Charles Hilton Seely | 4,002 | 50.4 | ||
Liberal | Charles Henry Roberts | 3,935 | 49.6 | ||
Majority | 67 | 0.8 | |||
Turnout | |||||
Liberal Unionist hold | Swing | ||||
See also
Notes
- ↑ A borough constituency (for the purposes of election expenses and type of returning officer)
- ↑ As with all constituencies, the constituency elects one Member of Parliament (MP) by the first past the post system of election at least every five years.
- ↑ Lincoln Cathedral was from 1311 until an intense storm in 1549 the world's tallest building
- ↑ Changed seat in 1983 to serve Derby South which she has held to date (winning most recently in 2010)
References
- ↑ "Electorate Figures - Boundary Commission for England". 2011 Electorate Figures. Boundary Commission for England. 4 March 2011. Retrieved 13 March 2011.
- 1 2 Members of Parliament 1213-1702. London: House of Commons. 1878.
- ↑ "SALTBY, Robert, of Lincoln.". History of Parliament. Retrieved 2014-07-30.
- 1 2 3 4 5 6 7 8 9 10 11 12 13 14 15 16 17 18 19 20 21 22 23 24 25 26 "History of Parliament". Retrieved 2011-09-19.
- ↑ "Fitzwilliam, Sir Thomas, Speaker of the House of Commons". Oxford DNB. Retrieved 2011-12-01.
- 1 2 3 4 5 6 7 8 9 10 11 12 13 14 "History of Parliament". Retrieved 2011-09-19.
- 1 2 3 4 5 6 7 8 9 10 "History of Parliament". Retrieved 2011-09-19.
- 1 2 3 Leigh Rayment's Historical List of MPs – Constituencies beginning with "L" (part 3)
- ↑ Constantine Phipps later succeeded to the peerage as the 2nd Baron Mulgrave
- ↑ John Fenton-Cawthorne was expelled from the House of Commons on 2 May 1796
- ↑ Robert Hobart was known as Robert Hobart until 1793, and as Lord Hobart from 1793 until he acceded to the peerage in 1804 as the 4th Earl of Buckinghamshire
- ↑ Edward Lytton Bulwer was known as Bulwer-Lytton from 1844, and in 1866 became the 1st Baron Lytton
- ↑ The election in 1847 of Charles Seely was declared void on 10 March 1848
- ↑ Edward Heneage was later enobled as Baron Heneage
- ↑ "Election Data 2015". Electoral Calculus. Archived from the original on 17 October 2015. Retrieved 17 October 2015.
- ↑ "Lincoln parliamentary constituency". BBC News. Retrieved 8 May 2015.
- ↑ "Election Data 2010". Electoral Calculus. Archived from the original on 17 October 2015. Retrieved 17 October 2015.
- ↑ "Election Data 2005". Electoral Calculus. Archived from the original on 15 October 2011. Retrieved 18 October 2015.
- ↑ "Election Data 2001". Electoral Calculus. Archived from the original on 15 October 2011. Retrieved 18 October 2015.
- ↑ "Election Data 1997". Electoral Calculus. Archived from the original on 15 October 2011. Retrieved 18 October 2015.
- ↑ "Election Data 1992". Electoral Calculus. Archived from the original on 15 October 2011. Retrieved 18 October 2015.
- ↑ "Politics Resources". Election 1992. Politics Resources. 9 April 1992. Retrieved 2010-12-06.
- ↑ "Election Data 1987". Electoral Calculus. Archived from the original on 15 October 2011. Retrieved 18 October 2015.
- ↑ "Election Data 1983". Electoral Calculus. Archived from the original on 15 October 2011. Retrieved 18 October 2015.
- ↑ British Parliamentary Election Results 1918-1949, FWS Craig
- 1 2 3 4 British parliamentary election results, 1885-1918 (Craig)
Sources
- Guardian Unlimited Politics (Election results from 1992 to the present)
- http://www.psr.keele.ac.uk/ (Election results from 1951 to the present)
- Craig, F. W. S. (1989) [1977]. British parliamentary election results 1832–1885 (2nd ed.). Chichester: Parliamentary Research Services. p. 187. ISBN 0-900178-26-4.
- Craig, F. W. S. (1989) [1974]. British parliamentary election results 1885–1918 (2nd ed.). Chichester: Parliamentary Research Services. p. 137. ISBN 0-900178-27-2.
- Craig, F. W. S. (1983) [1969]. British parliamentary election results 1918–1949 (3rd ed.). Chichester: Parliamentary Research Services. p. 172. ISBN 0-900178-06-X.
Coordinates: 53°14′N 0°32′W / 53.23°N 0.54°W