Luxembourg general election, 1994
| | |||||||||||||||||||||||||||||||||||||||||||||||||||
| |||||||||||||||||||||||||||||||||||||||||||||||||||
| |||||||||||||||||||||||||||||||||||||||||||||||||||
|
| |||||||||||||||||||||||||||||||||||||||||||||||||||
| Results: CSV DP LSAP | |||||||||||||||||||||||||||||||||||||||||||||||||||
| |||||||||||||||||||||||||||||||||||||||||||||||||||
 |
| This article is part of a series on the politics and government of Luxembourg |
| Constitution |
|
Monarchy |
|
| Foreign relations |
General elections were held in Luxembourg on 12 June 1994,[1] alongside European Parliament elections. The Christian Social People's Party remained the largest party, winning 21 of the 60 seats in the Chamber of Deputies.[2] It continued the coalition government with the Luxembourg Socialist Workers' Party.[3]
Candidates
| List # | Party | Running in | Existing seats | ||||
|---|---|---|---|---|---|---|---|
| Centre | Est | Nord | Sud | ||||
| 1 | Luxembourg Socialist Workers' Party (LSAP) | |
|
|
|
18 | |
| 2 | National Movement | |
|
|
|
0 | |
| 3 | The Greens | |
|
|
|
4 | |
| 4 | Christian Social People's Party (CSV) | |
|
|
|
21[4] | |
| 5 | Action Committee for Democracy and Pensions Justice (ADR) | |
|
|
|
4[4][5] | |
| 6 | Communist Party (KPL) | |
|
|
|
0 | |
| 7 | Democratic Party (DP) | |
|
|
|
12[5] | |
| 8 | Luxembourg Sovereignty Group (GLS) | |
|
|
|
0 | |
| 9 | New Left | |
|
|
|
0 | |
| 10 | Neutral and Independent Human Rights Party (NOMP) | |
|
|
|
0 | |
| 11 | Luxembourg Association for an Improved Future (ALFA) | |
|
|
|
0 | |
| 12 | Party for Regional and Real Politics (PRP) | |
|
|
|
0 | |
Results
| Party | Votes | %[a] | Seats | +/– |
|---|---|---|---|---|
| Christian Social People's Party | 887,651 | 30.3 | 21 | –1 |
| Luxembourg Socialist Workers' Party | 797,450 | 25.4 | 17 | –1 |
| Democratic Party | 548,246 | 19.3 | 12 | +1 |
| Green List Ecological Initiative–Green Alternative Party | 303,991 | 9.9 | 5 | +1 |
| Action Committee for Democracy and Pensions Justice | 244,045 | 9.0 | 5 | +1 |
| National Movement | 82,851 | 2.6 | 0 | 0 |
| Communist Party of Luxembourg | 57,646 | 1.7 | 0 | –1 |
| New Left | 25,940 | 0.7 | 0 | New |
| Neutral and Independent Human Rights Party | 18,843 | 0.5 | 0 | New |
| Luxembourg Sovereignty Group | 16,160 | 0.5 | 0 | New |
| Other parties | 4,910 | 0.1 | 0 | – |
| Invalid/blank votes | 12,448 | – | – | – |
| Total | 191,724 | 100 | 60 | 0 |
| Registered voters/turnout | 217,131 | 88.3 | – | – |
| Source: Nohlen & Stöver | ||||
a The percentage of votes is not related to the number of votes in the table, as voters could cast more votes in some constituencies than others, and is instead calculated based on the proportion of votes received in each constituency.[6]
Results by locality

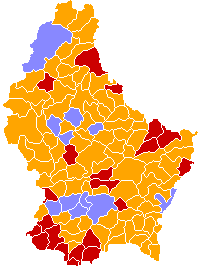
The CSV won pluralities in three of the four circonscriptions, coming behind the LSAP in that party's Sud stronghold. The CSV's vote was remarkably consistent across the whole of the country, whereas the other two main parties' votes varied wildly (particularly in Sud). The Greens and ADR won disproportionate number of votes in the east-central region and north respectively.[7]
| CSV | LSAP | DP | Greens | ADR | KPL | Other | |
|---|---|---|---|---|---|---|---|
| Centre | 29.2% | 18.9% | 27.1% | 10.7% | 7.8% | 1.1% | 5.2% |
| Est | 32.6% | 23.1% | 21.3% | 9.1% | 11.4% | 0.6% | 2.1% |
| Nord | 33.2% | 19.1% | 22.8% | 8.4% | 13.9% | 0.8% | 1.8% |
| Sud | 29.3% | 33.5% | 11.6% | 10.2% | 7.1% | 2.8% | 5.6% |
The CSV won pluralities across most of the country, winning more votes than any other party in 86 of the country's (then) 118 communes. The LSAP won pluralities in 21 communes, primarily in the Red Lands in the south. The DP won 12 communes, particularly in its heartland of Luxembourg City and the surrounding communes.[7]
References
- ↑ Nohlen, D & Stöver, P (2010) Elections in Europe: A data handbook, p1244 ISBN 978-3-8329-5609-7
- ↑ Nohlen & Stöver, p1262
- ↑ Nohlen & Stöver, p1236
- 1 2 Fernand Rau was elected as a member of the Christian Social People's Party in 1989, but defected to the Action Committee for Democracy and Pensions Justice.
- 1 2 Josy Simon was elected as a member of the Action Committee for Democracy and Pensions Justice in 1989, but defected to the Democratic Party.
- ↑ Nohlen & Stöver, p1254
- 1 2 "Répartition des suffrages en % du total des voix exprimés par parti et par commune 1994-2004" (in French). Statec. 15 October 2004. Retrieved 2008-03-17.
.jpg)

