Russian legislative election, 2003
| | |||||||||||||||||||||||||||||||||||||||||||||||||||||||||||||||||||||||||||||||||||||||||||||||
| |||||||||||||||||||||||||||||||||||||||||||||||||||||||||||||||||||||||||||||||||||||||||||||||
| |||||||||||||||||||||||||||||||||||||||||||||||||||||||||||||||||||||||||||||||||||||||||||||||
|
| |||||||||||||||||||||||||||||||||||||||||||||||||||||||||||||||||||||||||||||||||||||||||||||||
| Results of the 2003 legislative election in the Russian Federation by proportional representation | |||||||||||||||||||||||||||||||||||||||||||||||||||||||||||||||||||||||||||||||||||||||||||||||
| |||||||||||||||||||||||||||||||||||||||||||||||||||||||||||||||||||||||||||||||||||||||||||||||
.jpg)
.jpg)

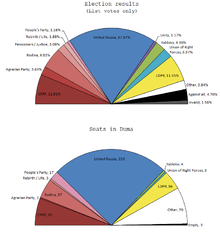
Election results
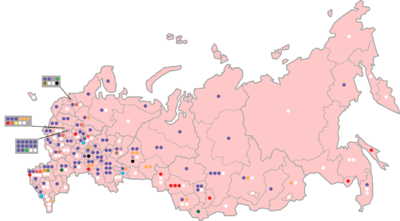
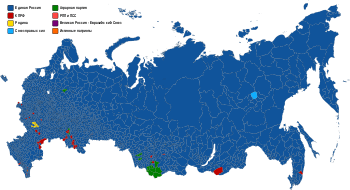
Distribution of the constituency seats by federal subject.
List
- United RussiaPeople's PartyCommunist PartyRodinaYablokoParty of Rebirth/Party of LifeUnion of Rightist ForcesAgrarian PartyGreat RussiaNew DealBusiness Development PartySelf-nominationsSeat not filled
Parliamentary elections were held in Russia on 7 December 2003.[1] At stake were the 450 seats in the State Duma (Gosudarstvennaya Duma), the lower house of the Federal Assembly of Russia (The legislature).
As expected, the United Russia pro-Vladimir Putin party won the largest number of votes and seats. Of the other parties, the Communist Party is still the largest, though much reduced in strength. Liberal Democratic Party improved its position by a few delegates. The liberal Yabloko party and the liberal-conservative Union of Rightist Forces lost most of its seats. The only other significant party is socialist Homeland Union.
Official results
| Party | PR | Constituency | Total seats |
+/– | ||||
|---|---|---|---|---|---|---|---|---|
| Votes | % | Seats | Votes | % | Seats | |||
| United Russia | 22,776,294 | 37.6 | 120 | 14,123,625 | 23.9 | 103 | 223 | New |
| Communist Party | 7,647,820 | 12.6 | 40 | 6,577,598 | 11.2 | 12 | 52 | –61 |
| Zhirinovsky Bloc | 6,944,322 | 11.5 | 36 | 1,860,905 | 3.2 | 0 | 36 | +19 |
| Rodina | 5,470,429 | 9.0 | 29 | 1,719,147 | 2.9 | 8 | 37 | New |
| Yabloko | 2,610,087 | 4.3 | 0 | 1,580,629 | 2.7 | 4 | 4 | –16 |
| Union of Rightist Forces | 2,408,535 | 4.0 | 0 | 1,764,290 | 3.0 | 3 | 3 | –26 |
| Agrarian Party | 2,205,850 | 3.6 | 0 | 1,104,974 | 1.9 | 2 | 2 | New |
| Russian Pensioners' Party-Party of Social Justice | 1,874,973 | 3.1 | 0 | 342,891 | 0.6 | 0 | 0 | –1 |
| Party of Russia's Rebirth-Russian Party of Life | 1,140,413 | 1.9 | 0 | 1,584,904 | 2.7 | 3 | 3 | New |
| People's Party | 714,705 | 1.2 | 0 | 2,677,889 | 4.5 | 17 | 17 | New |
| Unity | 710,721 | 1.2 | 0 | 9,334 | 0.0 | 0 | 0 | –73 |
| New Course–Automobile Russia | 509,302 | 0.8 | 0 | 222,090 | 0.4 | 1 | 1 | New |
| For a Holy Russia | 298,826 | 0.5 | 0 | 59,986 | 0.1 | 0 | 0 | New |
| Russian Ecological Party "The Greens" | 253,985 | 0.4 | 0 | 69,585 | 0.1 | 0 | 0 | 0 |
| Development of Enterprise | 212,827 | 0.4 | 0 | 237,527 | 0.4 | 1 | 1 | New |
| Great Russia–Eurasian Union | 170,796 | 0.3 | 0 | 464,602 | 0.8 | 1 | 1 | New |
| Genuine Patriots of Russia | 149,151 | 0.3 | 0 | 2,564 | 0.0 | 0 | 0 | New |
| Peace and Unity | 148,954 | 0.3 | 0 | 10,664 | 0.0 | 0 | 0 | 0 |
| United Russian Party Rus' | 147,441 | 0.2 | 0 | 570,453 | 1.0 | 0 | 0 | New |
| Democratic Party of Russia | 136,295 | 0.2 | 0 | 94,810 | 0.2 | 0 | 0 | New |
| Russian Constitutional Democratic Party | 113,190 | 0.2 | 0 | – | – | – | 0 | New |
| Union of People for Education and Science | 107,448 | 0.2 | 0 | 16,111 | 0.0 | 0 | 0 | New |
| People's Republican Party | 80,420 | 0.1 | 0 | 2,995 | 0.0 | 0 | 0 | New |
| Other parties | – | – | – | 288,866 | 0.5 | 0 | 0 | – |
| Independents | – | – | – | 15,843,626 | 26.9 | 67 | 67 | –38 |
| Against all | 2,851,958 | 4.7 | – | 7,744,998 | 13.1 | – | – | – |
| Vacant seats | – | – | – | – | – | 3 | 3 | – |
| Invalid/blank votes | 948,435 | – | – | 1,247,491 | – | – | – | – |
| Total | 60,633,177 | 100 | 225 | 60,222,554 | 100 | 225 | 450 | 0 |
| Registered voters/turnout | 108,906,250 | 55.7 | – | 108,906,250 | 55.3 | – | – | – |
| Source: Nohlen & Stöver, IPU, 2003 elections[2] | ||||||||
References
- ↑ Nohlen, D & Stöver, P (2010) Elections in Europe: A data handbook, p1642 ISBN 978-3-8329-5609-7
- ↑ Сведения о зарегистрированных депутатах ГД ФС РФ четвертого созыва по одномандатным избирательным округам (Russian)
External links
- Election results - official information (Russian)
| Presidential elections | |
|---|---|
| Legislative elections | |
| Gubernatorial elections | |
| Regional elections | |
| Referendums | |
See also: Elections and referendums in the Soviet Union | |
This article is issued from Wikipedia - version of the 9/18/2016. The text is available under the Creative Commons Attribution/Share Alike but additional terms may apply for the media files.