Statewide opinion polling for the United States presidential election, 2008
2008 U.S. Presidential Election |
|---|
|
| Democratic Party |
| Republican Party |
| Minor parties |
This article provides a collection of statewide public opinion polls that were conducted relating to the United States presidential election, 2008.
-
Democratic nominee
Barack Obama -
Republican nominee
John McCain -
Democratic Vice Presidential nominee
Joe Biden -

Republican Vice Presidential nominee
Sarah Palin
Opinion polling
 Alabama
9 electoral votes
(Republican in 2000 & 2004)
| Alabama opinion polls | ||||||
|---|---|---|---|---|---|---|
| Poll Source | Date administered (2008) | Democrat | % | Republican | % | Lead Margin |
| Survey USA | Oct 27–28 | Barack Obama | 36% | John McCain | 61% | |
| Capital Survey Research Center | Oct 15–21 | Barack Obama | 34% | John McCain | 54% | |
| Survey USA | Oct 8–9 | Barack Obama | 35% | John McCain | 62% | |
| Capital Research Center | Oct 6–7 | Barack Obama | 35% | John McCain | 54.5% | |
| Rasmussen Reports | Sept 22 | Barack Obama | 39% | John McCain | 60% | |
| Survey USA | Sept 16–17 | Barack Obama | 34% | John McCain | 64% | |
| American Research Group | Sept 13–16 | Barack Obama | 36% | John McCain | 58% | |
| University of South Alabama/ Press-Register |
Sept 8–15 | Barack Obama | 25% | John McCain | 52% | |
| Capital Survey Research Center/ Alabama Education Association |
Sept 3–9 | Barack Obama | 35% | John McCain | 55% | |
| Capital Survey Research Center/ Alabama Education Association |
July 29 – Aug 4 | Barack Obama | 34% | John McCain | 47% | |
| Rasmussen Reports | July 31 | Barack Obama | 38% | John McCain | 58% | |
 Alaska
3 electoral votes
(Republican in 2000 & 2004)
| Alaska opinion polls | ||||||
|---|---|---|---|---|---|---|
| Poll Source | Date administered (2008) | Democrat | % | Republican | % | Lead Margin |
| Hays Research ** | Nov 2 | Barack Obama | 45% | John McCain | 48% | |
| Research 2000/Daily Kos | Oct 28–30 | Barack Obama | 39% | John McCain | 58% | |
| Rasmussen Reports | Oct 28 | Barack Obama | 41% | John McCain | 57% | |
| Ivan Moore Research | Oct 17–19 | Barack Obama | 42% | John McCain | 53% | |
| Research 2000/ Daily Kos |
Oct 14–16 | Barack Obama | 38% | John McCain | 57% | |
| Rasmussen Reports | Oct 6 | Barack Obama | 40% | John McCain | 55% | |
| Fairleigh Dickinson University | Sept 17–21 | Barack Obama | 37% | John McCain | 55% | |
| Research 2000/ Daily Kos |
Sept 15–17 | Barack Obama | 38% | John McCain | 55% | |
| American Research Group | Sept 9-11 | Barack Obama | 39% | John McCain | 55% | |
| Rasmussen Reports | Sept 9 | Barack Obama | 33% | John McCain | 64% | |
| American Viewpoint ** | Sept 2 | Barack Obama | 33% | John McCain | 57% | |
| Ivan Moore Research | Aug 30- Sept 2 |
Barack Obama | 34.9% | John McCain | 53.5% | |
| Hays Research Group ** | Aug 6–7 | Barack Obama | 45% | John McCain | 40% | |
| Rasmussen Reports | July 30 | Barack Obama | 42% | John McCain | 48% | |
| Ivan Moore Research | July 18–22 | Barack Obama | 44% | John McCain | 47% | |
| Rasmussen Reports | July 17 | Barack Obama | 44% | John McCain | 49% | |
| Research 2000/ Daily Kos |
July 14–16 | Barack Obama | 41% | John McCain | 51% | |
 Arizona
10 electoral votes
(Republican in 2000 & 2004)
| Arizona opinion polls | ||||||
|---|---|---|---|---|---|---|
| Poll Source | Date administered (2008) | Democrat | % | Republican | % | Lead Margin |
| American Research Group | Oct 28–30 | Barack Obama | 46% | John McCain | 50% | |
| Research 2000/Daily Kos | Oct 28–30 | Barack Obama | 47% | John McCain | 48% | |
| NBC News/Mason Dixon | Oct 27–28 | Barack Obama | 44% | John McCain | 48% | |
| CNN/Time Magazine/ Opinion Research |
Oct 23–28 | Barack Obama | 46% | John McCain | 53% | |
| Northern Arizona University/ University of Washington |
Oct 18–27 | Barack Obama | 41% | John McCain | 49% | |
| Rasmussen Reports | Oct 26 | Barack Obama | 46% | John McCain | 51% | |
| Arizona State University/ Cronkite/Eight |
Oct 23–26 | Barack Obama | 44% | John McCain | 46% | |
| Myers Research/Grove Insight/ Project New West ** |
Oct 23–25 | Barack Obama | 40% | John McCain | 44% | |
| Zimmerman & Associates/ Marketing Intelligence ** |
Oct 16–18 | Barack Obama | 41.5% | John McCain | 43.5% | |
| Rasmussen Reports | Sept 29 | Barack Obama | 38% | John McCain | 59% | |
| Arizona State University/ Cronkite/Eight |
Sept 25–28 | Barack Obama | 38% | John McCain | 45% | |
| American Research Group | Sept 11–14 | Barack Obama | 39% | John McCain | 56% | |
| Walter Cronkite School/ Channel 8 (KAET) |
Aug 20 | Barack Obama | 30% | John McCain | 40% | |
| Mason-Dixon | Aug 13–15 | Barack Obama | 41% | John McCain | 47% | |
| Public Policy Polling(PPP) | July 30–31 | Barack Obama | 40% | John McCain | 52% | |
| Rasmussen Reports | July 30 | Barack Obama | 38% | John McCain | 57% | |
 Arkansas
6 electoral votes
(Republican in 2000 & 2004)
| Arkansas opinion polls | ||||||
|---|---|---|---|---|---|---|
| Poll Source | Date administered (2008) | Democrat | % | Republican | % | Lead Margin |
| American Research Group | Oct 28–31 | Barack Obama | 44% | John McCain | 51% | |
| Rasmussen Reports | Oct 27 | Barack Obama | 44% | John McCain | 54% | |
| Research 2000/Daily Kos | Oct 21–22 | Barack Obama | 41% | John McCain | 52% | |
| University of Arkansas | Oct 1–21 | Barack Obama | 36% | John McCain | 51% | |
| Rasmussen Reports | Sept 22 | Barack Obama | 42% | John McCain | 51% | |
| American Research Group | Sept 20–22 | Barack Obama | 41% | John McCain | 53% | |
| Rasmussen Reports | July 17 | Barack Obama | 39% | John McCain | 52% | |
 California
55 electoral votes
(Democrat in 2000 & 2004)
| California opinion polls | ||||||
|---|---|---|---|---|---|---|
| Poll Source | Date administered (2008) | Democrat | % | Republican | % | Lead Margin |
| Survey USA | Oct 29–31 | Barack Obama | 60% | John McCain | 36% | |
| Field Poll | Oct 18–28 | Barack Obama | 55% | John McCain | 33% | |
| Rasmussen Reports | Oct 25 | Barack Obama | 61% | John McCain | 34% | |
| Public Policy Institute of California | Oct 12–19 | Barack Obama | 56% | John McCain | 33% | |
| Survey USA | Oct 15–16 | Barack Obama | 59% | John McCain | 35% | |
| Rasmussen Reports | Oct 9 | Barack Obama | 56% | John McCain | 40% | |
| Survey USA | Oct 4–5 | Barack Obama | 55% | John McCain | 39% | |
| Survey USA | Sept 23–24 | Barack Obama | 53% | John McCain | 43% | |
| Rasmussen Reports | Sept 22 | Barack Obama | 56% | John McCain | 39% | |
| American Research Group | Sept 18–20 | Barack Obama | 53% | John McCain | 39% | |
| Public Policy Institute of California | Sept 9–16 | Barack Obama | 50% | John McCain | 40% | |
| Field Research Corporation | Sept 5–14 | Barack Obama | 52% | John McCain | 36% | |
| Rasmussen Reports | Aug 21 | Barack Obama | 54% | John McCain | 41% | |
| Public Policy Institute of California | Aug 12–19 | Barack Obama | 48% | John McCain | 39% | |
| Rasmussen Reports | July 24 | Barack Obama | 52% | John McCain | 42% | |
| Public Policy Institute of California | July 8–22 | Barack Obama | 50% | John McCain | 35% | |
| Field Research Corporation | July 8–14 | Barack Obama | 54% | John McCain | 30% | |
| Zogby International * | June 11–30 | Barack Obama | 52% | John McCain | 32% | |
| Rasmussen Reports | June 23 | Barack Obama | 58% | John McCain | 30% | |
 Colorado
9 electoral votes
(Republican in 2000 & 2004)
| Colorado opinion polls | ||||||||
|---|---|---|---|---|---|---|---|---|
| Poll Source | Date administered (2008) | Democrat | % | Republican | % | Lead Margin | Others | % |
| Rasmussen/Fox News | Nov 2 | Barack Obama | 51% | John McCain | 47% | |||
| American Research Group | Oct 28–30 | Barack Obama | 52% | John McCain | 45% | |||
| Public Policy Polling | Oct 28–30 | Barack Obama | 54% | John McCain | 44% | |||
| Denver Post/Mason-Dixon | Oct 28–29 | Barack Obama | 49% | John McCain | 44% | |||
| Marist College | Oct 27–28 | Barack Obama | 51% | John McCain | 45% | |||
| CNN/Time Magazine/ Opinion Research |
Oct 23–28 | Barack Obama | 53% | John McCain | 45% | |||
| Allstate/National Journal/FD | Oct 23–27 | Barack Obama | 48% | John McCain | 44% | |||
| Politico/InsiderAdvantage | Oct 26 | Barack Obama | 53% | John McCain | 45% | |||
| Rasmussen Reports/ Fox News |
Oct 26 | Barack Obama | 50% | John McCain | 46% | |||
| Associated Press/GfK | Oct 22–26 | Barack Obama | 50% | John McCain | 41% | |||
| Rocky Mountain News/ CBS4 News/ Public Opinion Strategies |
Oct 21–23 | Barack Obama | 52% | John McCain | 40% | |||
| InsiderAdvantage/ Poll Position |
Oct 20 | Barack Obama | 51% | John McCain | 46% | |||
| Rasmussen Reports/ Fox News |
Oct 19 | Barack Obama | 51% | John McCain | 46% | |||
| Rasmussen Reports | Oct 16 | Barack Obama | 52% | John McCain | 45% | |||
| CNN/Time Magazine/ Opinion Research |
Oct 11–14 | Barack Obama | 51% | John McCain | 47% | |||
| Suffolk University | Oct 10–13 | Barack Obama | 47% | John McCain | 43% | |||
| Quinnipiac University/ Wall Street Journal/ Washington Post |
Oct 8–12 | Barack Obama | 52% | John McCain | 43% | |||
| Public Policy Polling | Oct 8–10 | Barack Obama | 52% | John McCain | 42% | |||
| InsiderAdvantage/ Poll Position |
Oct 6 | Barack Obama | 51% | John McCain | 45% | |||
| Rasmussen Reports Fox News |
Oct 5 | Barack Obama | 51% | John McCain | 45% | |||
| Mason Dixon/Denver Post | Sept 29 – Oct 1 | Barack Obama | 44% | John McCain | 44% | |||
| Rasmussen Reports/ Fox News |
Sept 28 | Barack Obama | 49% | John McCain | 48% | |||
| American Research Group | Sept 23–25 | Barack Obama | 45% | John McCain | 48% | |||
| Insider Advantage/ Poll Position |
Sept 23 | Barack Obama | 50% | John McCain | 41% | |||
| Rasmussen Reports | Sept 23 | Barack Obama | 50% | John McCain | 47% | |||
| CNN/Time Magazine | Sept 21–23 | Barack Obama | 49% | John McCain | 45% | |||
| Ciruli Associates/ Economic Development Council of Colorado |
Sept 19–23 | Barack Obama | 44% | John McCain | 43% | |||
| Public Policy Polling | Sept 20–21 | Barack Obama | 51% | John McCain | 44% | |||
| Quinnipiac University/ Wall Street Journal/ Washington Post |
Sept 14–21 | Barack Obama | 49% | John McCain | 45% | |||
| Insider Advantage/ Poll Position |
Sept 17 | Barack Obama | 51% | John McCain | 41% | |||
| Allstate/National Journal/FD | Sept 11–15 | Barack Obama | 45% | John McCain | 44% | |||
| Fox News/ Rasmussen Reports |
Sept 14 | Barack Obama | 46% | John McCain | 48% | |||
| American Research Group | Sept 10–13 | Barack Obama | 44% | John McCain | 46% | |||
| InsiderAdvantage/ Poll Position |
Sept 10 | Barack Obama | 49% | John McCain | 46% | |||
| Public Policy Polling | Sept 9 | Barack Obama | 47% | John McCain | 46% | |||
| Fox News/ Rasmussen Reports |
Sept 7 | Barack Obama | 49% | John McCain | 46% | |||
| Tarrance Group ** | Sept 2–3 | Barack Obama | 45% | John McCain | 47% | |||
| CNN/Time Magazine/ Opinion Research |
Aug 24–26 | Barack Obama | 46% | John McCain | 47% | |||
| Hill Research Consultants ** | Aug 23–24 | Barack Obama | 43% | John McCain | 40% | |||
| Suffolk University | Aug 21–24 | Barack Obama | 44% | John McCain | 39% | |||
| Quinnipiac University | Aug 15–21 | Barack Obama | 46% | John McCain | 47% | Ralph Nader | 2% | |
| Other | 8% | |||||||
| Mason Dixon | Aug 13–15 | Barack Obama | 46% | John McCain | 43% | |||
| Rasmussen Reports | Aug 13 | Barack Obama | 48% | John McCain | 49% | |||
| Rocky Mtn News/CBS4 | Aug 11–13 | Barack Obama | 41% | John McCain | 44% | Bob Barr | 3% | |
| Ralph Nader | 2% | |||||||
| Other | 2% | |||||||
| Public Policy Polling | Aug 5–7 | Barack Obama | 48% | John McCain | 44% | |||
| FrederickPolls | July 16–22 | Barack Obama | 45% | John McCain | 41% | |||
| Quinnipiac University/ Wall Street Journal/ Washington Post |
July 14–22 | Barack Obama | 44% | John McCain | 46% | Other | 3% | |
| Rasmussen Reports | July 21 | Barack Obama | 50% | John McCain | 47% | |||
| Public Policy Polling | July 9–10 | Barack Obama | 47% | John McCain | 43% | |||
| Zogby International * | June 11–30 | Barack Obama | 40% | John McCain | 38% | Bob Barr | 8% | |
| Ralph Nader | 2% | |||||||
| Other | 4% | |||||||
 Connecticut
7 electoral votes
(Democrat in 2000 & 2004)
| Connecticut opinion polls | ||||||
|---|---|---|---|---|---|---|
| Poll Source | Date administered (2008) | Democrat | % | Republican | % | Lead Margin |
| Hartford Courant/ University of Connecticut |
Oct 18–22 | Barack Obama | 56% | John McCain | 31% | |
| Rasmussen Reports | Oct 14 | Barack Obama | 56% | John McCain | 39% | |
| Survey USA | Sept 24–25 | Barack Obama | 54% | John McCain | 38% | |
| American Research Group | Sept 17–19 | Barack Obama | 54% | John McCain | 39% | |
| Rasmussen Reports | Sept 16 | Barack Obama | 53% | John McCain | 41% | |
| Rasmussen Reports | July 31 | Barack Obama | 51% | John McCain | 36% | |
| Research 2000/ Daily Kos |
June 30 – July 2 | Barack Obama | 57% | John McCain | 35% | |
| Rasmussen Reports | July 1 | Barack Obama | 52% | John McCain | 35% | |
 Delaware
3 electoral votes
(Democrat in 2000 & 2004)
| Delaware opinion polls | ||||||
|---|---|---|---|---|---|---|
| Poll Source | Date administered (2008) | Democrat | % | Republican | % | Lead Margin |
| Survey USA | Oct 27–28 | Barack Obama | 63% | John McCain | 33% | |
| Rasmussen Reports | Oct 10 | Barack Obama | 56% | John McCain | 41% | |
| West Chester University | Oct 6–8 | Barack Obama | 55% | John McCain | 38% | |
| Survey USA | Sept 22–23 | Barack Obama | 57% | John McCain | 37% | |
| Fairleigh Dickinson University | Sept 17–21 | Barack Obama | 56% | John McCain | 36% | |
| American Research Group | Sept 13–15 | Barack Obama | 51% | John McCain | 40% | |
| Rasmussen Reports | Sept 13 | Barack Obama | 55% | John McCain | 43% | |
 District of Columbia
3 electoral votes
(Democrat in 2000 & 2004)
| District of Columbia opinion polls | ||||||
|---|---|---|---|---|---|---|
| Poll Source | Date administered (2008) | Democrat | % | Republican | % | Lead Margin |
| American Research Group | Sept 11–13 | Barack Obama | 82% | John McCain | 13% | |
 Florida
27 electoral votes
(Republican in 2000 & 2004)
| Florida opinion polls | ||||||
|---|---|---|---|---|---|---|
| Poll Source | Date administered (2008) | Democrat | % | Republican | % | Lead Margin |
| SurveyUSA | Oct 31 – Nov 3 | Barack Obama | 50% | John McCain | 47% | |
| Reuters/Zogby | Oct 31 – Nov 3 | Barack Obama | 49.25% | John McCain | 48% | |
| Datamar Inc. | Nov 1–2 | Barack Obama | 47% | John McCain | 48.2% | |
| Rasmussen Reports | Nov 2 | Barack Obama | 49% | John McCain | 50% | |
| Strategic Vision | Oct 31 – Nov 2 | Barack Obama | 49% | John McCain | 47% | |
| Public Policy Polling | Oct 31 – Nov 2 | Barack Obama | 50% | John McCain | 48% | |
| Reuters/Zogby | Oct 30 – Nov 2 | Barack Obama | 47.5% | John McCain | 46.2% | |
| Quinnipiac University | Oct 27 – Nov 2 | Barack Obama | 47% | John McCain | 45% | |
| American Research Group | Oct 29–31 | Barack Obama | 50% | John McCain | 46% | |
| Datamar Inc. | Oct 29–30 | Barack Obama | 46.7% | John McCain | 46.7% | |
| Mason-Dixon | Oct 29–30 | Barack Obama | 49% | John McCain | 47% | |
| CNN/Time Magazine/ Opinion Research |
Oct 23–28 | Barack Obama | 51% | John McCain | 47% | |
| Los Angeles Times/ Bloomberg |
Oct 25–27 | Barack Obama | 50% | John McCain | 43% | |
| Allstate/National Journal/FD | Oct 23–27 | Barack Obama | 45% | John McCain | 44% | |
| Suffolk University | Oct 26 | Barack Obama | 49% | John McCain | 44% | |
| Rasmussen Reports/ Fox News |
Oct 26 | Barack Obama | 51% | John McCain | 47% | |
| Datamar Inc. | Oct 25–26 | Barack Obama | 49.2% | John McCain | 44.4% | |
| Reuters/Zogby | Oct 23–26 | Barack Obama | 47.2% | John McCain | 46.9% | |
| Quinnipiac University | Oct 22–26 | Barack Obama | 47% | John McCain | 45% | |
| Associated Press/GfK | Oct 22–26 | Barack Obama | 45% | John McCain | 43% | |
| Politico/ InsiderAdvantage |
Oct 22 | Barack Obama | 48% | John McCain | 47% | |
| Strategic Vision | Oct 20–22 | Barack Obama | 46% | John McCain | 48% | |
| St. Petersburg Times/ Bay News 9/ Miami Herald |
Oct 20–22 | Barack Obama | 49% | John McCain | 42% | |
| NBC/Mason-Dixon | Oct 20–21 | Barack Obama | 45% | John McCain | 46% | |
| Quinnipiac University | Oct 16–21 | Barack Obama | 49% | John McCain | 44% | |
| Rasmussen Reports/ |
Oct 19 | Barack Obama | 48% | John McCain | 49% | |
| Public Policy Polling | Oct 16–19 | Barack Obama | 48% | John McCain | 47% | |
| SurveyUSA | Oct 16 | Barack Obama | 47% | John McCain | 49% | |
| Research 2000 Times-Union South Florida Sun Sentinel |
Oct 13–15 | Barack Obama | 49% | John McCain | 45% | |
| CNN/Time Magazine/ Opinion Research |
Oct 11–14 | Barack obama | 51% | John McCain | 46% | |
| InsiderAdvantage/ Poll Position |
Oct 13 | Barack Obama | 48% | John McCain | 44% | |
| Rasmussen Reports Fox News |
Oct 12 | Barack Obama | 51% | John McCain | 46% | |
| Rasmussen Reports | Oct 8 | Barack Obama | 50% | John McCain | 47% | |
| Strategic Vision | Oct 6–8 | Barack Obama | 52% | John McCain | 44% | |
| Research 2000 | Oct 6–8 | Barack Obama | 49% | John McCain | 44% | |
| NBC/Mason-Dixon | Oct 4–6 | Barack Obama | 48% | John McCain | 46% | |
| Rasmussen Reports/ Fox News |
Oct 5 | Barack Obama | 52% | John McCain | 45% | |
| InsiderAdvantage/ Poll Position |
Sept 30 | Barack Obama | 49% | John McCain | 46% | |
| CNN/Time Magazine/ Opinion Research |
Sept 28–30 | Barack Obama | 51% | John McCain | 47% | |
| Suffolk University/WSVN | Sept 27–30 | Barack Obama | 46% | John McCain | 42% | |
| Quinnipiac University | Sept 27–29 | Barack Obama | 51% | John McCain | 43% | |
| Rasmussen Reports/ |
Sept 28 | Barack Obama | 48% | John McCain | 48% | |
| Public Policy Polling | Sept 27–28 | Barack Obama | 49% | John McCain | 46% | |
| SurveyUSA | Sept 27–28 | Barack Obama | 47% | John McCain | 48% | |
| American Research Group | Sept 23–25 | Barack Obama | 47% | John McCain | 46% | |
| Rasmussen Reports | Sept 24 | Barack Obama | 47% | John McCain | 48% | |
| Strategic Vision | Sept 20–22 | Barack Obama | 45% | John McCain | 48% | |
| Fox News/ Rasmussen Reports |
Sept 21 | Barack Obama | 46% | John McCain | 51% | |
| NBC/Mason Dixon | Sept 16–18 | Barack Obama | 47% | John McCain | 45% | |
| Florida Times-Union/ South Florida Sun-Sentinel/ Research 2000 |
Sept 15–18 | Barack Obama | 45% | John McCain | 46% | |
| SurveyUSA | Sept 16–17 | Barack Obama | 45% | John McCain | 51% | |
| American Research Group | Sept 14–17 | Barack Obama | 46% | John McCain | 46% | |
| Miami Herald/ St. Petersberg Times/ Schroth, Eldon & Associates/ The Polling Company |
Sept 14–17 | Barack Obama | 45% | John McCain | 47% | |
| CNN/Time Magazine/ Opinion Research |
Sept 14–16 | Barack Obama | 48% | John McCain | 48% | |
| Allstate/National Journal/FD | Sept 11–15 | Barack Obama | 44% | John McCain | 44% | |
| Fox News/ Rasmussen Reports |
Sept 14 | Barack Obama | 44% | John McCain | 49% | |
| Insider Advantage/ Poll Position |
Sept 10 | Barack Obama | 42% | John McCain | 50% | |
| Quinnipiac University | Sept 5–9 | Barack Obama | 43% | John McCain | 50% | |
.svg.png) Georgia
Georgia
15 electoral votes
(Republican in 2000 & 2004)
| Georgia opinion polls | ||||||
|---|---|---|---|---|---|---|
| Poll Source | Date administered (2008) | Democrat | % | Republican | % | Lead Margin |
| InsiderAdvantage/ Poll Position |
Nov 2 | Barack Obama | 47% | John McCain | 48% | |
| Strategic Vision | Oct 31 – Nov 2 | Barack Obama | 46% | John McCain | 50% | |
| Public Policy Polling | Oct 31 – Nov 2 | Barack Obama | 48% | John McCain | 50% | |
| SurveyUSA/ 13WAMZ |
Oct 30 – Nov 2 | Barack Obama | 45% | John McCain | 52% | |
| Rasmussen Reports | Oct 30 | Barack Obama | 47% | John McCain | 52% | |
| Research 2000/Daily Kos | Oct 28–30 | Barack Obama | 44% | John McCain | 47% | |
| CNN/Time Magazine/ Opinion Research |
Oct 23–28 | Barack Obama | 47% | John McCain | 52% | |
| InsiderAdvantage/ Poll Position |
Oct 27 | Barack Obama | 47% | John McCain | 48% | |
| InsiderAdvantage/ Poll Position |
Oct 23 | Barack Obama | 48% | John McCain | 47% | |
| Mason-Dixon/NBC | Oct 22–23 | Barack Obama | 43% | John McCain | 49% | |
| Rasmussen Reports | Oct 22 | Barack Obama | 46% | John McCain | 51% | |
| Strategic Vision | Oct 20–22 | Barack Obama | 45% | John McCain | 51% | |
| Democracy Corps/ Greenberg, Quinlan, Rosner ** |
Oct 16–19 | Barack Obama | 44% | John McCain | 46% | |
| Research 2000/Daily Kos | Oct 14–15 | Barack Obama | 43% | John McCain | 49% | |
| CNN/Time Magazine/ Opinion Research |
Oct 11–14 | Barack Obama | 45% | John McCain | 51% | |
| SurveyUSA | Oct 12 | Barack Obama | 43% | John McCain | 51% | |
| InsiderAdvantage/ Poll Position |
Oct 9 | Barack Obama | 46% | John McCain | 49% | |
| Rasmussen Reports | Oct 7 | Barack Obama | 45% | John McCain | 54% | |
| Strategic Vision | Oct 5–7 | Barack Obama | 43% | John McCain | 50% | |
| Research 2000/Daily Kos | Sept 29 – Oct 1 | Barack Obama | 43% | John McCain | 50% | |
| InsiderAdvantage/ Poll Position |
Sept 30 | Barack Obama | 44% | John McCain | 50% | |
| SurveyUSA | Sept 28–29 | Barack Obama | 44% | John McCain | 52% | |
| American Research Group | Sept 18–21 | Barack Obama | 39% | John McCain | 57% | |
| Rasmussen Reports | Sept 18 | Barack Obama | 43% | John McCain | 54% | |
| InsiderAdvantage/ Poll Position |
Sept 17 | Barack Obama | 43% | John McCain | 51% | |
| SurveyUSA | Sept 14–16 | Barack Obama | 41% | John McCain | 57% | |
| Public Opinion Strategies | Sept 9-11 | Barack Obama | 35% | John McCain | 56% | |
| InsiderAdvantage/ Poll Position |
Sept 10 | Barack Obama | 38% | John McCain | 56% | |
| Strategic Vision | Sept 7–9 | Barack Obama | 39% | John McCain | 52% | |
| Rasmussen Reports | Aug 14 | Barack Obama | 44% | John McCain | 53% | |
| Rasmussen Reports | July 17 | Barack Obama | 42% | John McCain | 53% | |
| InsiderAdvantage/ Poll Position/ Majority Opinion Research |
July 2 | Barack Obama | 44% | John McCain | 46% | |
 Hawaii
4 electoral votes
(Democrat in 2000 & 2004)
| Hawaii opinion polls | ||||||
|---|---|---|---|---|---|---|
| Poll Source | Date administered (2008) | Democrat | % | Republican | % | Lead Margin |
| Rasmussen Reports | Sept 23 | Barack Obama | 68% | John McCain | 27% | |
| American Research Group | Sept 7–12 | Barack Obama | 63% | John McCain | 32% | |
| Survey USA | Feb 26–29 | Barack Obama | 61% | John McCain | 31% | |
 Idaho
Idaho
4 electoral votes
(Republican in 2000 & 2004)
| Idaho opinion polls | ||||||
|---|---|---|---|---|---|---|
| Poll Source | Date administered (2008) | Democrat | % | Republican | % | Lead Margin |
| Harstead Strategic Research | Oct 19–22 | Barack Obama | 32% | John McCain | 55% | |
| Research 2000/Daily Kos | Sept 16–17 | Barack Obama | 33% | John McCain | 62% | |
| American Research Group | Sept 8–10 | Barack Obama | 25% | John McCain | 68% | |
| Rasmussen Reports | Sept 9 | Barack Obama | 29% | John McCain | 68% | |
| Greg Smith & Associates | Aug 18–22 | Barack Obama | 29% | John McCain | 52% | |
| Research 2000/Daily Kos | July 28–30 | Barack Obama | 37% | John McCain | 53% | |
 Illinois
21 electoral votes
(Democrat in 2000 & 2004)
| Illinois opinion polls | ||||||
|---|---|---|---|---|---|---|
| Poll Source | Date administered (2008) | Democrat | % | Republican | % | Lead Margin |
| Rasmussen Reports | Nov 1 | Barack Obama | 60% | John McCain | 38% | |
| Research 2000 | Oct 20–23 | Barack Obama | 59% | John McCain | 35% | |
| Big Ten Poll | Oct 19–22 | Barack Obama | 61% | John McCain | 32% | |
| Chicago Tribune | Oct 16–18 | Barack Obama | 56% | John McCain | 32% | |
| Rasmussen Reports | Oct 13 | Barack Obama | 56% | John McCain | 39% | |
| St Louis Post-Dispatch/ Research 2000 |
Sept 15–18 | Barack Obama | 56% | John McCain | 36% | |
| Rasmussen Reports | Sept 17 | Barack Obama | 56% | John McCain | 40% | |
| Big Ten Poll | Sept 14–17 | Barack Obama | 53% | John McCain | 37% | |
| American Research Group | Sept 13–16 | Barack Obama | 51% | John McCain | 45% | |
| Rasmussen Reports | Aug 12 | Barack Obama | 55% | John McCain | 40% | |
| Rasmussen Reports | July 8 | Barack Obama | 52% | John McCain | 41% | |
 Indiana
11 electoral votes
(Republican in 2000 & 2004)
| Indiana opinion polls | ||||||
|---|---|---|---|---|---|---|
| Poll Source | Date administered (2008) | Democrat | % | Republican | % | Lead Margin |
| Reuters/Zogby | Oct 31 – Nov 3 | Barack Obama | 45.1% | John McCain | 50.4% | |
| Public Policy Polling | Oct 31 – Nov 2 | Barack Obama | 49% | John McCain | 48% | |
| Reuters/Zogby | Oct 30 – Nov 2 | Barack Obama | 43.9% | John McCain | 49.1% | |
| American Research Group | Oct 28–31 | Barack Obama | 48% | John McCain | 48% | |
| SurveyUSA/ Mike Downs Center |
Oct 27–30 | Barack Obama | 47% | John McCain | 47% | |
| Rasmussen Reports | Oct 28–29 | Barack Obama | 46% | John McCain | 49% | |
| Indianapolis Star/WTHR/ Selzer & Co. |
Oct 26–28 | Barack Obama | 45.9% | John McCain | 45.3% | |
| Research 2000/WISH-TV | Oct 24–28 | Barack Obama | 47% | John McCain | 47% | |
| Reuters/Zogby | Oct 23–26 | Barack Obama | 44% | John McCain | 50.2% | |
| Research 2000/ South Bend Tribune/ WSBT-TV |
Oct 23–25 | Barack Obama | 48% | John McCain | 47% | |
| Howey/Gauge | Oct 23–25 | Barack Obama | 45% | John McCain | 47% | |
| Survey USA | Oct 21–22 | Barack Obama | 49% | John McCain | 45% | |
| Big Ten Poll | Oct 19–22 | Barack Obama | 51% | John McCain | 41% | |
| Public Policy Polling | Oct 18–19 | Barack Obama | 48% | John McCain | 46% | |
| Rasmussen Reports | Oct 7 | Barack Obama | 43% | John McCain | 50% | |
| CNN/Time Magazine/ Opinion Research |
Oct 3–6 | Barack Obama | 46% | John McCain | 51% | |
| Research 2000/WISH-TV | Sept 29 – Oct 3 | Barack Obama | 46% | John McCain | 46% | |
| Research 2000 | Sept 28–29 | Barack Obama | 45% | John McCain | 46% | |
| Survey USA | Sept 28–29 | Barack Obama | 45% | John McCain | 48% | |
| Rasmussen Reports | Sept 17–18 | Barack Obama | 47% | John McCain | 49% | |
| American Research Group | Sept 14–18 | Barack Obama | 44% | John McCain | 47% | |
| Big Ten Poll | Sept 14–17 | Barack Obama | 43% | John McCain | 47% | |
| Indianapolis Star/WTHR/ Selzer & Co. |
Sept 14–16 | Barack Obama | 47% | John McCain | 44% | |
| CNN/Time Magazine/ Opinion Research |
Sept 14–16 | Barack Obama | 45% | John McCain | 51% | |
| Howey/Gauge | Aug 29–30 | Barack Obama | 43% | John McCain | 45% | |
| Rasmussen Reports | Aug 19–21 | Barack Obama | 43% | John McCain | 49% | |
| Survey USA | Aug 16–18 | Barack Obama | 44% | John McCain | 50% | |
 Iowa
Iowa
7 electoral votes
(Democrat in 2000)
(Republican in 2004)
| Iowa opinion polls | ||||||
|---|---|---|---|---|---|---|
| Poll Source | Date administered (2008) | Democrat | % | Republican | % | Lead Margin |
| Des Moines Register/ Selzer & Co. |
Oct 28–31 | Barack Obama | 54% | John McCain | 37% | |
| SurveyUSA | Oct 28–29 | Barack Obama | 55% | John McCain | 40% | |
| Research 2000/ KCCI-TV |
Oct 27–29 | Barack Obama | 53% | John McCain | 39% | |
| Marist College | Oct 23–24 | Barack Obama | 52% | John McCain | 42% | |
| Rasmussen Reports | Oct 23 | Barack Obama | 52% | John McCain | 44% | |
| Mason-Dixon/NBC | Oct 22–23 | Barack Obama | 51% | John McCain | 40% | |
| Quad City Times/ Research 2000 |
Oct 19–22 | Barack Obama | 54% | John McCain | 39% | |
| Big Ten Poll | Oct 19–22 | Barack Obama | 52% | John McCain | 39% | |
| SurveyUSA | Oct 8–9 | Barack Obama | 54% | John McCain | 41% | |
| Research 2000/ KCCI-TV |
Sept 29–30 | Barack Obama | 55% | John McCain | 39% | |
| Rasmussen Reports | Sept 25 | Barack Obama | 51% | John McCain | 43% | |
| Marist College | Sept 18–21 | Barack Obama | 51% | John McCain | 41% | |
| American Research Group | Sept 17–20 | Barack Obama | 51% | John McCain | 44% | |
| SurveyUSA | Sept 17–18 | Barack Obama | 54% | John McCain | 43% | |
| Quad-City Times/ Lee Enterprises |
Sept 15–17 | Barack Obama | 53% | John McCain | 39% | |
| Big Ten Poll | Sept 14–17 | Barack Obama | 45% | John McCain | 45% | |
| Des Moines Register/ Selzer & Co. |
Sept 8–10 | Barack Obama | 52% | John McCain | 40% | |
| CNN/Time Magazine/ Opinion Research |
Aug 31 – Sept 2 | Barack Obama | 55% | John McCain | 40% | |
| Hawkeye Poll | Aug 13 | Barack Obama | 49.5% | John McCain | 43.1% | |
| Rasmussen Reports | Aug 7 | Barack Obama | 49% | John McCain | 44% | |
| Rasmussen Reports | July 10 | Barack Obama | 51% | John McCain | 41% | |
 Kansas
6 electoral votes
(Republican in 2000 & 2004)
| Kansas opinion polls | ||||||
|---|---|---|---|---|---|---|
| Poll Source | Date administered (2008) | Democrat | % | Republican | % | Lead Margin |
| SurveyUSA | Oct 27–28 | Barack Obama | 37% | John McCain | 58% | |
| SurveyUSA | Oct 21–22 | Barack Obama | 41% | John McCain | 53% | |
| Rasmussen Reports | Oct 13 | Barack Obama | 41% | John McCain | 54% | |
| SurveyUSA | Sept 21–22 | Barack Obama | 41% | John McCain | 53% | |
| Rasmussen Reports | Sept 18 | Barack Obama | 38% | John McCain | 58% | |
| American Research Group | Sept 7–10 | Barack Obama | 31% | John McCain | 63% | |
| SurveyUSA | Aug 18–20 | Barack Obama | 35% | John McCain | 58% | |
| Rasmussen Reports | Aug 11 | Barack Obama | 41% | John McCain | 55% | |
| Rasmussen Reports | July 14 | Barack Obama | 35% | John McCain | 58% | |
 Kentucky
8 electoral votes
(Republican in 2000 & 2004)
| Kentucky opinion polls | ||||||
|---|---|---|---|---|---|---|
| Poll Source | Date administered (2008) | Democrat | % | Republican | % | Lead Margin |
| Survey USA | Nov 1 | Barack Obama | 40% | John McCain | 56% | |
| Rasmussen Reports | Oct 29 | Barack Obama | 42% | John McCain | 51% | |
| Louisville Courier-Journal/ Mason-Dixon |
Oct 27–29 | Barack Obama | 43% | John McCain | 55% | |
| Research 2000/Daily Kos | Oct 27–29 | Barack Obama | 39% | John McCain | 56% | |
| Rasmussen Reports | Oct 21 | Barack Obama | 44% | John McCain | 52% | |
| Research 2000/ Lexington Herald-Leader/ WKYT-TV |
Oct 19–21 | Barack Obama | 39% | John McCain | 55% | |
| Survey USA | Oct 18–20 | Barack Obama | 41% | John McCain | 54% | |
| Research 2000/Daily Kos | Oct 15–16 | Barack Obama | 39% | John McCain | 53% | |
| Rasmussen Reports | Sept 30 | Barack Obama | 42% | John McCain | 52% | |
| Louisville Courier-Journal/ Mason-Dixon |
Sept 22–25 | Barack Obama | 41% | John McCain | 53% | |
| Survey USA | Sept 21–22 | Barack Obama | 38% | John McCain | 57% | |
| Research 2000/Daily Kos | Sept 15–17 | Barack Obama | 37% | John McCain | 55% | |
| American Research Group | Sept 8–12 | Barack Obama | 37% | John McCain | 57% | |
| Survey USA | Aug 9-11 | Barack Obama | 37% | John McCain | 55% | |
| Research 2000/Daily Kos | July 28–30 | Barack Obama | 35% | John McCain | 56% | |
| Rasmussen Reports | July 29 | Barack Obama | 43% | John McCain | 52% | |
 Louisiana
9 electoral votes
(Republican in 2000 & 2004)
| Louisiana opinion polls | ||||||
|---|---|---|---|---|---|---|
| Poll Source | Date administered (2008) | Democrat | % | Republican | % | Lead Margin |
| Loyola University/ WAFB 9News |
Oct 24–26 | Barack Obama | 40% | John McCain | 43% | |
| SE Louisiana University | Oct 20–23 | Barack Obama | 38.3% | John McCain | 50.6% | |
| Rasmussen Reports | Oct 21 | Barack Obama | 41% | John McCain | 57% | |
| Rasmussen Reports | Sept 25 | Barack Obama | 40% | John McCain | 55% | |
| American Research Group | Sept 9–12 | Barack Obama | 43% | John McCain | 50% | |
| Rasmussen Reports | Aug 17 | Barack Obama | 39% | John McCain | 57% | |
| Rasmussen Reports | July 9 | Barack Obama | 37% | John McCain | 56% | |
 Maine
Maine
4 electoral votes
(Democrat in 2000 & 2004)
| Maine opinion polls | ||||||
|---|---|---|---|---|---|---|
| Poll Source | Date administered (2008) | Democrat | % | Republican | % | Lead Margin |
| Rasmussen Reports | Nov 1 | Barack Obama | 56% | John McCain | 43% | |
| SurveyUSA | Oct 19–20 | Barack Obama | 54% | John McCain | 39% | |
| Critical Insights | Oct 16–19 | Barack Obama | 56% | John McCain | 35% | |
| Pan Atlantic SMS | Oct 13–16 | Barack Obama | 51% | John McCain | 39% | |
| Research 2000/Daily Kos | Oct 14–15 | Barack Obama | 55% | John McCain | 38% | |
| Rasmussen Reports | Oct 2 | Barack Obama | 51% | John McCain | 46% | |
| SurveyUSA | Sept 22–23 | Barack Obama | 49% | John McCain | 44% | |
| Rasmussen Reports | Sept 17 | Barack Obama | 50% | John McCain | 46% | |
| American Research Group | Sept 8–10 | Barack Obama | 51% | John McCain | 41% | |
| Research 2000/ Daily Kos |
Sept 8–10 | Barack Obama | 52% | John McCain | 38% | |
| Rasmussen Reports | Aug 12 | Barack Obama | 53% | John McCain | 39% | |
| Rasmussen Reports | July 17 | Barack Obama | 49% | John McCain | 41% | |
 Maryland
10 electoral votes
(Democrat in 2000 & 2004)
| Maryland opinion polls | ||||||
|---|---|---|---|---|---|---|
| Poll Source | Date administered (2008) | Democrat | % | Republican | % | Lead Margin |
| Rasmussen Reports | Sept 20 | Barack Obama | 60% | John McCain | 37% | |
| American Research Group | Sept 17–19 | Barack Obama | 54% | John McCain | 39% | |
| Gonzales Research & Marketing Strategies |
Aug 29 – Sept 5 | Barack Obama | 52% | John McCain | 38% | |
| Rasmussen Reports | Aug 18 | Barack Obama | 53% | John McCain | 43% | |
 Massachusetts
12 electoral votes
(Democrat in 2000 & 2004)
| Massachusetts opinion polls | ||||||
|---|---|---|---|---|---|---|
| Poll Source | Date administered (2008) | Democrat | % | Republican | % | Lead Margin |
| Survey USA | Oct 28 | Barack Obama | 56% | John McCain | 39% | |
| Survey USA | Oct 14 | Barack Obama | 59% | John McCain | 35% | |
| Rasmussen Reports | Oct 13 | Barack Obama | 62% | John McCain | 34% | |
| Rasmussen Reports | Sept 23 | Barack Obama | 58% | John McCain | 38% | |
| Survey USA | Sept 22–23 | Barack Obama | 55% | John McCain | 39% | |
| American Research Group | Sept 20–22 | Barack Obama | 55% | John McCain | 39% | |
| Rasmussen Reports | Aug 5 | Barack Obama | 54% | John McCain | 38% | |
| Suffolk University | July 31 – Aug 3 | Barack Obama | 47% | John McCain | 38% | |
 Michigan
17 electoral votes
(Democrat in 2000 & 2004)
| Michigan opinion polls | ||||||||
|---|---|---|---|---|---|---|---|---|
| Poll Source | Date administered (2008) | Democrat | % | Republican | % | Lead Margin | Others | % |
| Selzer/Detroit Free Press/WDIV | Oct 28–31 | Barack Obama | 53% | John McCain | 37% | |||
| Public Policy Polling | Oct 28–30 | Barack Obama | 55% | John McCain | 42% | |||
| Strategic Vision | Oct 27–29 | Barack Obama | 54% | John McCain | 41% | |||
| Rasmussen Reports | Oct 28 | Barack Obama | 53% | John McCain | 43% | |||
| Detroit News/ EPIC-MRA |
Oct 26–28 | Barack Obama | 50% | John McCain | 38% | |||
| Big Ten Poll | Oct 19–22 | Barack Obama | 58% | John McCain | 36% | |||
| Detroit News/ EPIC-MRA |
Oct 19–22 | Barack Obama | 51% | John McCain | 37% | |||
| Quinnipiac University/ Wall Street Journal/ Washington Post |
October 8–12 | Barack Obama | 54% | John McCain | 38% | |||
| Rasmussen Reports | October 8 | Barack Obama | 56% | John McCain | 40% | |||
| Rossman/Denno-Noor/ MIRS |
October 1–4 | Barack Obama | 44% | John McCain | 39% | Other | ~4% | |
| Public Policy Polling | September 29- October 1 |
Barack Obama | 51% | John McCain | 41% | |||
| Selzer/Detroit Free Press/ WDIV |
September 22–24 | Barack Obama | 51% | John McCain | 38% | |||
| Strategic Vision | September 22–24 | Barack Obama | 48% | John McCain | 45% | |||
| CNN/Time Magazine/ Opinion Research |
September 21–23 | Barack Obama | 49% | John McCain | 43% | |||
| NBC/Mason-Dixon | Sept 18–23 | Barack Obama | 46% | John McCain | 46% | |||
| EPIC-MRA/ Detroit News |
Sept 20–22 | Barack Obama | 48% | John McCain | 38% | |||
| Allstate/National Journal/ FD |
Sept 18–22 | Barack Obama | 47% | John McCain | 39% | |||
| Rasmussen Reports/ Fox News |
Sept 21 | Barack Obama | 51% | John McCain | 44% | |||
| Quinnipiac University/ Wall Street Journal/ Washington Post |
Sept 14–21 | Barack Obama | 48% | John McCain | 44% | |||
| American Research Group | Sept 16–19 | Barack Obama | 48% | John McCain | 46% | |||
| Marketing Resource Group of Lansing |
Sept 15–19 | Barack Obama | 43% | John McCain | 46% | |||
| Marist College | Sept 16–17 | Barack Obama | 52% | John McCain | 43% | |||
| EPIC-MRA/ Detroit News |
September 14–17 | Barack Obama | 45% | John McCain | 42% | |||
| Big Ten Poll | Sept 14–17 | Barack Obama | 48% | John McCain | 44% | |||
| Rasmussen Reports | September 10 | Barack Obama | 51% | John McCain | 46% | |||
| InsiderAdantagev/ Poll Position |
September 10 | Barack Obama | 44% | John McCain | 45% | |||
| CNN/Time Magazine/ Opinion Research |
September 7–9 | Barack Obama | 45% | John McCain | 42% | |||
| Public Policy Polling | September 6–7 | Barack Obama | 47% | John McCain | 46% | |||
| Strategic Vision | September 5–7 | Barack Obama | 45% | John McCain | 44% | |||
| EPIC-MRA/ Detroit News |
Aug 18–21 | Barack Obama | 43% | John McCain | 41% | |||
| Selzer/ Detroit Free Press/ WDIV |
Aug 17–20[1] | Barack Obama | 46% | John McCain | 39% | |||
| Rasmussen Reports | Aug 7 | Barack Obama | 49% | John McCain | 45% | |||
| Public Policy Polling | July 23–27 | Barack Obama | 46% | John McCain | 43% | |||
| Quinnipiac University/ Wall Street Journal/ Washington Post |
July 14–22 | Barack Obama | 46% | John McCain | 42% | |||
| Detroit News/ EPIC-MRA |
July 13–16 | Barack Obama | 43% | John McCain | 41% | |||
| Rasmussen Reports | July 10 | Barack Obama | 50% | John McCain | 42% | |||
 Minnesota
10 electoral votes
(Democrat in 2000 & 2004)
| Minnesota opinion polls | ||||||
|---|---|---|---|---|---|---|
| Poll Source | Date administered (2008) | Democrat | % | Republican | % | Lead Margin |
| SurveyUSA | October 30 – Nov 1 | Barack Obama | 49% | John McCain | 46% | |
| Star Tribune/Princeton Survey Research Associates International |
October 29–31 | Barack Obama | 53% | John McCain | 42% | |
| Public Policy Polling | Oct 28–30 | Barack Obama | 57% | John McCain | 41% | |
| Research 2000/Daily Kos | Oct 27–29 | Barack Obama | 53% | John McCain | 38% | |
| Rasmussen Reports | Oct 28 | Barack Obama | 55% | John McCain | 43% | |
| NBC News/Mason Dixon | Oct 27–28 | Barack Obama | 48% | John McCain | 40% | |
| University of Minnesota/ Minnesota Public Radio News |
Oct 24–28 | Barack Obama | 56% | John McCain | 37% | |
| Rasmussen Reports | Oct 22 | Barack Obama | 56% | John McCain | 41% | |
| Big Ten Poll | Oct 19–22 | Barack Obama | 57% | John McCain | 38% | |
| St. Cloud State University | Oct 14–22 | Barack Obama | 42% | John McCain | 37% | |
| National Journal/FD | Oct 16–20 | Barack Obama | 50% | John McCain | 40% | |
| SurveyUSA | October 16–18 | Barack Obama | 50% | John McCain | 44% | |
| Star Tribune/Princeton Survey Research Associates International |
October 16–17 | Barack Obama | 52% | John McCain | 41% | |
| Research 2000/Daily Kos | October 15–16 | Barack Obama | 52% | John McCain | 39% | |
| Quinnipiac University/ Wall Street Journal/ Washington Post |
October 8–12 | Barack Obama | 51% | John McCain | 40% | |
| Rasmussen Reports | Oct 7 | Barack Obama | 52% | John McCain | 45% | |
| American Research Group | Oct 4–7 | Barack Obama | 47% | John McCain | 46% | |
| Minnesota Public Radio News/Humphrey Institute |
Oct 3–5 | Barack Obama | 54% | John McCain | 40% | |
| Star Tribune/ Princeton Survey Research Associates International |
Sept 30- October 2 |
Barack Obama | 55% | John McCain | 37% | |
| SurveyUSA | Sept 30- October 1 |
Barack Obama | 46% | John McCain | 47% | |
| Minnesota Public Radio News/Humphrey Institute |
Sept 29- October 1 |
Barack Obama | 47% | John McCain | 43% | |
| CNN/Time Magazine/ Opinion Research |
Sept 28–30 | Barack Obama | 54% | John McCain | 43% | |
| Quinnipiac University/ Wall Street Journal/ Washington Post |
Sept 14–21 | Barack Obama | 47% | John McCain | 45% | |
| American Research Group | Sept 18–20 | Barack Obama | 48% | John McCain | 47% | |
| Rasmussen Reports | Sept 18 | Barack Obama | 52% | John McCain | 44% | |
| Big Ten Poll | Sept 14–17 | Barack Obama | 47% | John McCain | 45% | |
| Star Tribune Minnesota/ Princeton Survey Research Associates International |
Sept 10–12 | Barack Obama | 45% | John McCain | 45% | |
| Survey USA | Sept 10–11 | Barack Obama | 49% | John McCain | 47% | |
| CNN/Time Magazine/ Opinion Research |
Aug 31- September 2 |
Barack Obama | 53% | John McCain | 41% | |
| Minnesota Public Radio/ University of Minnesota |
Aug 7–17 | Barack Obama | 48% | John McCain | 38% | |
| Survey USA | Aug 13–14 | Barack Obama | 47% | John McCain | 45% | |
| Rasmussen Reports | Aug 13 | Barack Obama | 49% | John McCain | 45% | |
| Rasmussen Reports | July 22 | Barack Obama | 52% | John McCain | 39% | |
| Quinnipiac University/ Wall Street Journal/ Washington Post |
July 14–22 | Barack Obama | 46% | John McCain | 44% | |
| Rasmussen Reports | July 10 | Barack Obama | 54% | John McCain | 37% | |
 Mississippi
6 electoral votes
(Republican in 2000 & 2004)
| Mississippi opinion polls | ||||||
|---|---|---|---|---|---|---|
| Poll Source | Date administered (2008) | Democrat | % | Republican | % | Lead Margin |
| Research 2000/ Daily Kos |
Oct 27–29 | Barack Obama | 40% | John McCain | 53% | |
| Rasmussen Reports | Oct 27 | Barack Obama | 45% | John McCain | 53% | |
| Press-Register/ University of South Alabama |
Oct 13–23 | Barack Obama | 33% | John McCain | 46% | |
| Research 2000/ Daily Kos |
Oct 14–15 | Barack Obama | 40% | John McCain | 50% | |
| Rasmussen Reports | Sept 30 | Barack Obama | 44% | John McCain | 52% | |
| American Research Group | Sept 13–16 | Barack Obama | 39% | John McCain | 55% | |
| Research 2000/ Daily Kos |
Sept 8–10 | Barack Obama | 37% | John McCain | 55% | |
| Rasmussen Reports | Aug 21 | Barack Obama | 43% | John McCain | 56% | |
| Rasmussen Reports | July 28 | Barack Obama | 42% | John McCain | 54% | |
| Research 2000/ Daily Kos |
July 21–23 | Barack Obama | 42% | John McCain | 51% | |
 Missouri
for earlier results
11 electoral votes
(Republican in 2000 & 2004)
| Missouri opinion polls | ||||||
|---|---|---|---|---|---|---|
| Poll Source | Date administered (2008) | Democrat | % | Republican | % | Lead Margin |
| Reuters/Zogby | Oct 31 – Nov 3 | Barack Obama | 48.8% | John McCain | 48.8% | |
| Rasmussen Reports/ Fox News |
Nov 2 | Barack Obama | 49% | John McCain | 49% | |
| Public Policy Polling | Oct 31 – Nov 2 | Barack Obama | 49.4% | John McCain | 48.6% | |
| Reuters/Zogby | Oct 30 – Nov 2 | Barack Obama | 47.4% | John McCain | 45.7% | |
| Survey USA | Oct 30 – Nov 2 | Barack Obama | 48% | John McCain | 48% | |
| American Research Group | Oct 28–30 | Barack Obama | 48% | John McCain | 48% | |
| Politico/ Insider Advantage |
Oct 29 | Barack Obama | 47% | John McCain | 50% | |
| Mason-Dixon/NBC | Oct 28–29 | Barack Obama | 46% | John McCain | 47% | |
| CNN/Time Magazine/ Opinion Research |
Oct 23–28 | Barack Obama | 48% | John McCain | 50% | |
| Rasmussen Reports/ Fox News |
Oct 26 | Barack Obama | 48% | John McCain | 47% | |
| Survey USA | Oct 25–26 | Barack Obama | 48% | John McCain | 48% | |
| Reuters/Zogby | Oct 23–26 | Barack Obama | 48.2% | John McCain | 45.7% | |
| Mason-Dixon/NBC | Oct 22–23 | Barack Obama | 45% | John McCain | 46% | |
| Research 2000/ Post-Dispatch |
Oct 20–23 | Barack Obama | 48% | John McCain | 47% | |
| Rasmussen Reports/ Fox News |
Oct 19 | Barack Obama | 49% | John McCain | 44% | |
| Suffolk University | Oct 17–19 | Barack Obama | 44% | John McCain | 45% | |
| Rasmussen Reports | Oct 15 | Barack Obama | 52% | John McCain | 46% | |
| CNN/Time Magazine/ Opinion Research |
Oct 11–14 | Barack Obama | 48% | John McCain | 49% | |
| Rasmussen Reports/ Fox News |
Oct 12 | Barack Obama | 50% | John McCain | 47% | |
| Public Policy Polling | Oct 11–12 | Barack Obama | 48% | John McCain | 46% | |
| SurveyUSA | Oct 10–12 | Barack Obama | 51% | John McCain | 43% | |
| American Research Group | Oct 4–6 | Barack Obama | 46% | John McCain | 49% | |
| Rasmussen Reports/ Fox News |
Oct 5 | Barack Obama | 50% | John McCain | 47% | |
| CNN/Time Magazine/ Opinion Research |
Sept 28–30 | Barack Obama | 49% | John McCain | 48% | |
| Survey USA | Sept 23–24 | Barack Obama | 46% | John McCain | 48% | |
| St Louis Post-Dispatch/ Research 2000 |
Sept 22–24 | Barack Obama | 47% | John McCain | 48% | |
| St Louis Post-Dispatch/ Research 2000 |
Sept 15–18 | Barack Obama | 45% | John McCain | 49% | |
| American Research Group | Sept 11–15 | Barack Obama | 45% | John McCain | 50% | |
| Rasmussen Reports | Sept 11 | Barack Obama | 46% | John McCain | 51% | |
| CNN/Time Magazine/ Opinion Research |
Sept 7–9 | Barack Obama | 44% | John McCain | 48% | |
| Public Policy Polling | Aug 13–17 | Barack Obama | 40% | John McCain | 50% | |
| Rasmussen Reports | Aug 7 | Barack Obama | 44% | John McCain | 50% | |
| Survey USA | July 29–31 | Barack Obama | 44% | John McCain | 49% | |
| Research 2000/ St. Louis Post Dispatch |
July 7–10 | Barack Obama | 48% | John McCain | 43% | |
| Rasmussen Reports | July 7 | Barack Obama | 42% | John McCain | 47% | |
| Public Policy Polling | July 2–5 | Barack Obama | 44% | John McCain | 47% | |
 Montana
3 electoral votes
(Republican in 2000 & 2004)
| Montana opinion polls | ||||||||
|---|---|---|---|---|---|---|---|---|
| Poll Source | Date administered (2008) | Democrat | % | Republican | % | Lead Margin | Other | % |
| Public Policy Polling | Oct 31 – Nov 2 | Barack Obama | 48% | John McCain | 47% | Ron Paul | 4% | |
| American Research Group | Oct 28–30 | Barack Obama | 46% | John McCain | 49% | |||
| Research 2000/Daily Kos | Oct 28–30 | Barack Obama | 44% | John McCain | 48% | |||
| Rasmussen Reports | Oct 29 | Barack Obama | 46% | John McCain | 50% | |||
| NBC/Mason-Dixon | Oct 23–25 | Barack Obama | 44% | John McCain | 48% | |||
| Montana State University | Oct 16–20 | Barack Obama | 44.4% | John McCain | 40.2% | Ron Paul‡ | 4.2% | |
| Research 2000/Daily Kos | Oct 15–16 | Barack Obama | 45% | John McCain | 49% | |||
| American Research Group | Oct 6–8 | Barack Obama | 45% | John McCain | 50% | |||
| Rasmussen Reports | Oct 1 | Barack Obama | 44% | John McCain | 52% | |||
| Research 2000/Daily Kos | Sept 22–24 | Barack Obama | 39% | John McCain | 52% | |||
| CNN/Time Magazine/ Opinion Research |
Sept 21–23 | Barack Obama | 40% | John McCain | 49% | Bob Barr | 1% | |
| Ralph Nader | 1% | |||||||
| American Research Group | Sept 7–9 | Barack Obama | 47% | John McCain | 49% | |||
| Rasmussen Reports | Sept 8 | Barack Obama | 42% | John McCain | 53% | |||
| Rasmussen Reports | July 31 | Barack Obama | 47% | John McCain | 47% | |||
‡ Ron Paul replaced Chuck Baldwin on the ballot in Montana.
 Nebraska
5 electoral votes
(Republican in 2000 & 2004)
| Nebraska opinion polls | ||||||
|---|---|---|---|---|---|---|
| Poll Source | Date administered (2008) | Democrat | % | Republican | % | Lead Margin |
| Rasmussen Reports | Sept 30 | Barack Obama | 37% | John McCain | 56% | |
| American Research Group | Sept 12–17 | Barack Obama | 34% | John McCain | 60% | |
| Rasmussen Reports | July 28 | Barack Obama | 36% | John McCain | 55% | |
| Rasmussen Reports | June 23 | Barack Obama | 36% | John McCain | 52% | |
 Nevada
5 electoral votes
(Republican in 2000 & 2004)
| Nevada opinion polls | ||||||
|---|---|---|---|---|---|---|
| Poll Source | Date administered (2008) | Democrat | % | Republican | % | Lead Margin |
| Reuters/Zogby | Oct 31 – Nov 3 | Barack Obama | 53.2% | John McCain | 42.4% | |
| Public Policy Polling | Oct 31 – Nov 2 | Barack Obama | 51% | John McCain | 47% | |
| Reuters/Zogby | Oct 30 – Nov 2 | Barack Obama | 50.7% | John McCain | 42.9% | |
| Las Vegas Review-Journal/ Mason-Dixon |
Oct 28–29 | Barack Obama | 47% | John McCain | 43% | |
| Reno Gazette-Journal/ Channel 2 |
Oct 23–28 | Barack Obama | 50% | John McCain | 45% | |
| CNN/Time Magazine/ Opinion Research |
Oct 23–28 | Barack Obama | 52% | John McCain | 45% | |
| Rasmussen Reports | Oct 27 | Barack Obama | 50% | John McCain | 46% | |
| Suffolk University | Oct 23–26 | Barack Obama | 50% | John McCain | 40% | |
| Reuters/Zogby | Oct 23–26 | Barack Obama | 48.2% | John McCain | 44% | |
| Associated Press/GfK | Oct 22–26 | Barack Obama | 52% | John McCain | 40% | |
| CNN/Time Magazine/ Opinion Research |
Oct 19–21 | Barack Obama | 51% | John McCain | 46% | |
| Politico/ InsiderAdvantage |
Oct 20 | Barack Obama | 47% | John McCain | 47% | |
| Rasmussen Reports | Oct 16 | Barack Obama | 50% | John McCain | 45% | |
| InsiderAdvantage/ Poll Position |
Oct 13 | Barack Obama | 49% | John McCain | 46% | |
| Las Vegas Review-Journal/ Mason-Dixon |
Oct 8–9 | Barack Obama | 47% | John McCain | 45% | |
| InsiderAdvantage/ Poll Position |
Oct 6 | Barack Obama | 49% | John McCain | 47% | |
| Reno Gazette-Journal/ Channel 2 News/ Research 2000 |
Oct 3–6 | Barack Obama | 50% | John McCain | 43% | |
| Rasmussen Reports | Oct 2 | Barack Obama | 51% | John McCain | 47% | |
| InsiderAdvantage/ Poll Position |
Sept 30 | Barack Obama | 48% | John McCain | 47% | |
| CNN/Time Magazine/ Opinion Research |
Sept 28–30 | Barack Obama | 51% | John McCain | 47% | |
| American Research Group | Sept 27–29 | Barack Obama | 47% | John McCain | 49% | |
| Suffolk University | Sept 17–21 | Barack Obama | 45% | John McCain | 46% | |
| Project New West/ Myers Research/ Grove Insight ** |
Sept 14–19 | Barack Obama | 47% | John McCain | 45% | |
| American Research Group | Sept 12–14 | Barack Obama | 46% | John McCain | 49% | |
| Rasmussen Reports | Sept 11 | Barack Obama | 46% | John McCain | 49% | |
| InsiderAdvantage/ Poll Position |
Sept 10 | Barack Obama | 45% | John McCain | 46% | |
| CNN/Time Magazine/ Opinion Research |
Aug 24–26 | Barack Obama | 49% | John McCain | 44% | |
| Research 2000/ Reno Gazette-Journal/KTVN |
Aug 18–20 | Barack Obama | 44% | John McCain | 43% | |
| Mason-Dixon/ Las Vegas Review Journal |
Aug 13–15 | Barack Obama | 39% | John McCain | 46% | |
| Rasmussen Reports | Aug 11 | Barack Obama | 45% | John McCain | 48% | |
| Rasmussen Reports | July 16 | Barack Obama | 47% | John McCain | 45% | |
 New Hampshire
4 electoral votes
(Republican in 2000)
(Democrat in 2004)
| New Hampshire opinion polls | ||||||||
|---|---|---|---|---|---|---|---|---|
| Poll Source | Date administered (2008) | Democrat | % | Republican | % | Lead Margin | Others | % |
| Rasmussen Reports | Oct 30 | Barack Obama | 51% | John McCain | 44% | |||
| SurveyUSA | Oct 29–30 | Barack Obama | 53% | John McCain | 42% | |||
| Univ. of New Hampshire/ WMUR |
Oct 28–30 | Barack Obama | 53% | John McCain | 39% | |||
| American Research Group | Oct 28–30 | Barack Obama | 56% | John McCain | 41% | |||
| Concord Monitor/ Research 2000 |
Oct 28–30 | Barack Obama | 51% | John McCain | 44% | |||
| Suffolk University | Oct 27–29 | Barack Obama | 53% | John McCain | 40% | |||
| Strategic Vision | Oct 27–29 | Barack Obama | 50% | John McCain | 41% | |||
| Univ. of New Hampshire/ WMUR |
Oct 25–27 | Barack Obama | 58% | John McCain | 33% | |||
| Univ. of New Hampshire/ WMUR |
Oct 24–26 | Barack Obama | 55% | John McCain | 39% | |||
| Associated Press/GfK | Oct 22–26 | Barack Obama | 55% | John McCain | 37% | |||
| NBC/Mason-Dixon | Oct 23–25 | Barack Obama | 50% | John McCain | 39% | |||
| Rasmussen Reports | Oct 23 | Barack Obama | 50% | John McCain | 46% | |||
| Marist College | Oct 22–23 | Barack Obama | 50% | John McCain | 45% | |||
| University of New Hampshire/ Boston Globe |
Oct 18–22 | Barack Obama | 54% | John McCain | 39% | |||
| Concord Mintor/ Research 2000 |
Oct 17–19 | Barack Obama | 50% | John McCain | 43% | |||
| American Research Group | Oct 6–8 | Barack Obama | 52% | John McCain | 43% | |||
| CNN/Time Magazin/ Opinion Research |
Oct 3–6 | Barack Obama | 53% | John McCain | 45% | |||
| Survey USA | Oct 4–5 | Barack Obama | 53% | John McCain | 40% | |||
| Rasmussen Reports | Oct 1 | Barack Obama | 53% | John McCain | 43% | |||
| St. Anselm/SRBI | Sept 25–30 | Barack Obama | 49% | John McCain | 37% | |||
| Concord Monitor/ Research 2000 |
Sept 22–24 | Barack Obama | 48% | John McCain | 44% | |||
| Strategic Vision | Sept 22–24 | Barack Obama | 46% | John McCain | 45% | |||
| Suffolk University | Sept 20–24 | Barack Obama | 46% | John McCain | 45% | |||
| Rasmussen Reports | Sept 23 | Barack Obama | 47% | John McCain | 49% | |||
| Allstate/National Journal/FD | Sept 18–22 | Barack Obama | 44% | John McCain | 43% | |||
| Marist College | Sept 17–21 | Barack Obama | 51% | John McCain | 45% | |||
| University of New Hampshire | Sept 14–21 | Barack Obama | 45% | John McCain | 47% | |||
| American Research Group | Sept 13–15 | Barack Obama | 45% | John McCain | 48% | Others | 1% | |
| CNN/Time Magazine/ Opinion Research |
Sept 9 | Barack Obama | 48% | John McCain | 43% | |||
| Rasmussen Reports | Aug 20 | Barack Obama | 47% | John McCain | 46% | |||
| American Research Group | Aug 18–20 | Barack Obama | 46% | John McCain | 45% | |||
| Rasmussen Reports | July 23 | Barack Obama | 49% | John McCain | 45% | |||
| American Research Group | July 19–21 | Barack Obama | 47% | John McCain | 45% | |||
| University of New Hampshire | July 11–20 | Barack Obama | 46% | John McCain | 43% | |||
 New Jersey
15 electoral votes
(Democrat in 2000 & 2004)
| New Jersey opinion polls | ||||||
|---|---|---|---|---|---|---|
| Poll Source | Date administered (2008) | Democrat | % | Republican | % | Lead Margin |
| Rasmussen Reports | Nov 2 | Barack Obama | 57% | John McCain | 42% | |
| Monmouth University/ Gannett New Jersey |
Oct 29–31 | Barack Obama | 55% | John McCain | 34% | |
| SurveyUSA | Oct 29–30 | Barack Obama | 52% | John McCain | 42% | |
| Fairleigh Dickinson University | Oct 23–29 | Barack Obama | 53% | John McCain | 35% | |
| The Record/Research 2000 | Oct 26–28 | Barack Obama | 54% | John McCain | 38% | |
| Strategic Vision | Oct 24–26 | Barack Obama | 53% | John McCain | 38% | |
| Marist College | Oct 20–21 | Barack Obama | 56% | John McCain | 39% | |
| Quinnipiac University | Oct 16–19 | Barack Obama | 59% | John McCain | 36% | |
| Monmouth University/ Gannett New Jersey |
Oct 15–18 | Barack Obama | 55% | John McCain | 38% | |
| SurveyUSA | Oct 12 | Barack Obama | 55% | John McCain | 40% | |
| Rasmussen Reports | Oct 7 | Barack Obama | 50% | John McCain | 42% | |
| Fairleigh Dickinson University | Sept 29- October 5 |
Barack Obama | 50% | John McCain | 37% | |
| SurveyUSA | Sept 27–28 | Barack Obama | 52% | John McCain | 42% | |
| Strategic Vision | Sept 26–28 | Barack Obama | 48% | John McCain | 39% | |
| American Research Group | Sept 19–21 | Barack Obama | 51% | John McCain | 42% | |
| Rasmussen Reports | Sept 16 | Barack Obama | 55% | John McCain | 42% | |
| Strategic Vision | Sept 14–16 | Barack Obama | 47% | John McCain | 43% | |
| Monmouth University/ Gannett New Jersey |
Sept 11–14 | Barack Obama | 49% | John McCain | 41% | |
| Quinnipiac University | Sept 10–14 | Barack Obama | 48% | John McCain | 45% | |
| The Record/ Research 2000 |
Sept 9-11 | Barack Obama | 50% | John McCain | 41% | |
| Marist College | Sept 5–8 | Barack Obama | 48% | John McCain | 45% | |
| Fairleigh Dickinson University | Sept 4–7 | Barack Obama | 47% | John McCain | 41% | |
| Quinnipiac University | Aug 4–10 | Barack Obama | 51% | John McCain | 41% | |
| Rasmussen Reports | Aug 4 | Barack Obama | 52% | John McCain | 42% | |
| Monmouth University/ Gannett New Jersey |
July 17–21 | Barack Obama | 50% | John McCain | 36% | |
| Strategic Vision | July 11–13 | Barack Obama | 47% | John McCain | 38% | |
| Rasmussen Reports | July 7 | Barack Obama | 47% | John McCain | 44% | |
 New Mexico
5 electoral votes
(Democrat in 2000)
(Republican in 2004)
| New Mexico opinion polls | ||||||||
|---|---|---|---|---|---|---|---|---|
| Poll Source | Date administered (2008) | Democrat | % | Republican | % | Lead Margin | Others | % |
| SurveyUSA | Oct 29–31 | Barack Obama | 52% | John McCain | 45% | |||
| Albuquerque Journal/ Research & Polling |
Oct 28–30 | Barack Obama | 51% | John McCain | 43% | |||
| Public Policy Polling | Oct 28–30 | Barack Obama | 58% | John McCain | 41% | |||
| Rasmussen Reports | Oct 28 | Barack Obama | 54% | John McCain | 44% | |||
| Rasmussen Reports | Oct 13 | Barack Obama | 55% | John McCain | 42% | |||
| SurveyUSA | Oct 12–13 | Barack Obama | 52% | John McCain | 45% | |||
| Albuquerque Journal/ Research & Polling |
Sept 29- October 2 |
Barack Obama | 45% | John McCain | 40% | Ralph Nader | 1% | |
| Rasmussen Reports | Oct 1 | Barack Obama | 49% | John McCain | 44% | |||
| SurveyUSA | Sept 29–30 | Barack Obama | 52% | John McCain | 44% | |||
| Public Policy Polling | Sept 17–19 | Barack Obama | 53% | John McCain | 42% | |||
| SurveyUSA | Sept 14–16 | Barack Obama | 52% | John McCain | 44% | |||
| American Research Group | Sept 14–16 | Barack Obama | 51% | John McCain | 44% | |||
| Allstate/National Journal/ FD |
Sept 11–15 | Barack Obama | 49% | John McCain | 42% | |||
| Rasmussen Reports | Sept 8 | Barack Obama | 47% | John McCain | 49% | |||
| CNN/Time Magazine/ Opinion Research |
Aug 24–26 | Barack Obama | 53% | John McCain | 40% | |||
| Rasmussen Reports | Aug 20 | Barack Obama | 48% | John McCain | 44% | |||
| Mason-Dixon | Aug 13–15 | Barack Obama | 41% | John McCain | 45% | |||
| Rasmussen Reports | July 24 | Barack Obama | 49% | John McCain | 43% | |||
 New York
31 electoral votes
(Democrat in 2000 & 2004)
| New York opinion polls | ||||||
|---|---|---|---|---|---|---|
| Poll Source | Date administered (2008) | Democrat | % | Republican | % | Lead Margin |
| Survey USA | Oct 27–28 | Barack Obama | 62% | John McCain | 33% | |
| Marist College | Oct 21–22 | Barack Obama | 65% | John McCain | 29% | |
| Siena College | Oct 19–21 | Barack Obama | 62% | John McCain | 31% | |
| Rasmussen Reports | Oct 14 | Barack Obama | 57% | John McCain | 37% | |
| Survey USA | Oct 11–12 | Barack Obama | 64% | John McCain | 31% | |
| Survey USA | Sept 23–24 | Barack Obama | 57% | John McCain | 38% | |
| American Research Group | Sept 14–16 | Barack Obama | 55% | John McCain | 38% | |
| Rasmussen Reports | Sept 15 | Barack Obama | 55% | John McCain | 42% | |
| Siena College | Sept 8–10 | Barack Obama | 46% | John McCain | 41% | |
| Siena College | Aug 11–14 | Barack Obama | 47% | John McCain | 39% | |
| Rasmussen Reports | Aug 4 | Barack Obama | 55% | John McCain | 36% | |
| Quinnipiac University | July 31 – Aug 4 | Barack Obama | 57% | John McCain | 36% | |
| Siena College | July 17–29 | Barack Obama | 44% | John McCain | 26% | |
| Siena College | July 7–10 | Barack Obama | 50% | John McCain | 37% | |
 North Carolina
15 electoral votes
(Republican in 2000 & 2004)
| North Carolina opinion polls | ||||||
|---|---|---|---|---|---|---|
| Poll Source | Date administered (2008) | Democrat | % | Republican | % | Lead Margin |
| American Research Group | Oct 31 – Nov 3 | Barack Obama | 49% | John McCain | 48% | |
| Reuters/Zogby | Oct 31 – Nov 3 | Barack Obama | 49.5% | John McCain | 49.1% | |
| Rasmussen Reports | Nov 2 | Barack Obama | 49% | John McCain | 50% | |
| Survey USA | Oct 30 – Nov 2 | Barack Obama | 48% | John McCain | 49% | |
| Public Policy Polling | Oct 31 – Nov 2 | Barack Obama | 50% | John McCain | 49% | |
| Reuters/Zogby | Oct 30 – Nov 2 | Barack Obama | 47.7% | John McCain | 49.3% | |
| Research 2000/Daily Kos | Oct 28–30 | Barack Obama | 47% | John McCain | 45% | |
| Rasmussen Reports | Oct 29 | Barack Obama | 50% | John McCain | 48% | |
| Politico/ Insider Advantage |
Oct 29 | Barack Obama | 48% | John McCain | 48% | |
| Mason-Dixon/NBC | Oct 28–29 | Barack Obama | 46% | John McCain | 49% | |
| Civitas Institute/ TelOpinion |
Oct 27–29 | Barack Obama | 47% | John McCain | 46% | |
| CNN/Time Magazine/ Opinion Research |
Oct 23–28 | Barack Obama | 52% | John McCain | 46% | |
| Allstate/National Journal/FD | Oct 23–27 | Barack Obama | 47% | John McCain | 43% | |
| Rasmussen Reports/ Fox News |
Oct 26 | Barack Obama | 48% | John McCain | 49% | |
| Public Policy Polling | Oct 25–26 | Barack Obama | 49% | John McCain | 48% | |
| Reuters/Zogby | Oct 23–26 | Barack Obama | 49.7% | John McCain | 46.4% | |
| Associated Press/GfK | Oct 22–26 | Barack Obama | 48% | John McCain | 46% | |
| NBC/Mason-Dixon | Oct 23–25 | Barack Obama | 47% | John McCain | 47% | |
| Rasmussen Reports | Oct 23 | Barack Obama | 48% | John McCain | 50% | |
| WSOC-TV | Oct 20–21 | Barack Obama | 48.4% | John McCain | 46.4% | |
| CNN/Time Magazine/ Opinion Research |
Oct 19–21 | Barack Obama | 51% | John McCain | 47% | |
| InsiderAdvantage/ Politico |
Oct 20 | Barack Obama | 49% | John McCain | 48% | |
| SurveyUSA/WTVD-TV | Oct 18–20 | Barack Obama | 47% | John McCain | 47% | |
| Civitas Institute/ TelOpinion |
Oct 18–20 | Barack Obama | 48% | John McCain | 45% | |
| Rasmussen Reports/ Fox News |
Oct 19 | Barack Obama | 51% | John McCain | 48% | |
| Public Policy Polling | Oct 18–19 | Barack Obama | 51% | John McCain | 44% | |
| Winthrop University/ETV | Sept 28- October 19 |
Barack Obama | 44.6% | John McCain | 44.2% | |
| Research 2000/ Daily Kos |
Oct 14–15 | Barack Obama | 46% | John McCain | 44% | |
| InsiderAdvantage/ Poll Position |
Oct 13 | Barack Obama | 48% | John McCain | 46% | |
| Rasmussen Reports/ Fox News |
Oct 12 | Barack Obama | 48% | John McCain | 48% | |
| Public Policy Polling | Oct 11–12 | Barack Obama | 49% | John McCain | 46% | |
| Rasmussen Reports | Oct 8 | Barack Obama | 49% | John McCain | 48% | |
| Civitas/TelOpinion | Oct 6–8 | Barack Obama | 48% | John McCain | 43% | |
| WSOC-TV | Oct 6–7 | Barack Obama | 46% | John McCain | 47.8% | |
| SurveyUSA | Oct 5–6 | Barack Obama | 46% | John McCain | 49% | |
| CNN/Time Magazine/ Opinion Research |
Oct 3–6 | Barack Obama | 49% | John McCain | 49% | |
| Public Policy Polling | Oct 4–5 | Barack Obama | 50% | John McCain | 44% | |
| Rasmussen Reports | Sept 30 | Barack Obama | 50% | John McCain | 47% | |
| American Research Group | Sept 27–29 | Barack Obama | 46% | John McCain | 49% | |
| Public Policy Polling | 28 | Barack Obama | 47% | John McCain | 45% | |
| Rasmussen Reports | Sept 23 | Barack Obama | 49% | John McCain | 47% | |
| Civitas Institute/ Tel Opinion Research |
20 | Barack Obama | 45% | John McCain | 45% | |
| Public Policy Polling | Sept 17–19 | Barack Obama | 46% | John McCain | 46% | |
| Rasmussen Reports | Sept 18 | Barack Obama | 47% | John McCain | 50% | |
| CNN/Time Magazine/ Opinion Research |
Sept 14–16 | Barack Obama | 47% | John McCain | 48% | |
| American Research Group | Sept 13–16 | Barack Obama | 41% | John McCain | 52% | |
| Research 2000/ Daily Kos |
Sept 8–10 | Barack Obama | 38% | John McCain | 55% | |
| Civitas Institute/ Tel Opinion Research |
Sept 6–10 | Barack Obama | 44% | John McCain | 47% | |
| Public Policy Polling | Sept 9 | Barack Obama | 44% | John McCain | 48% | |
| SurveyUSA | Sept 6–8 | Barack Obama | 38% | John McCain | 58% | |
| Garin Hart Yang | Sept 5–7 | Barack Obama | 46% | John McCain | 49% | |
| Democracy Corps/ Greenberg Quinlan Rosner |
Aug 20–26 | Barack Obama | 44% | John McCain | 47% | |
| Public Policy Polling | Aug 23 | Barack Obama | 42% | John McCain | 45% | |
| InsiderAdvantage | Aug 19 | Barack Obama | 42.8% | John McCain | 44.5% | |
| Zogby International * | Aug 15–19 | Barack Obama | 47% | John McCain | 39% | |
| Civitas Institute/ Tel Opinion Research |
Aug 14–17 | Barack Obama | 40% | John McCain | 46% | |
| Rasmussen Reports | Aug 13 | Barack Obama | 44% | John McCain | 50% | |
| Survey USA | Aug 9-11 | Barack Obama | 45% | John McCain | 49% | |
| Research 2000/Daily Kos | July 28–30 | Barack Obama | 43% | John McCain | 47% | |
| Public Policy Polling | July 23–27 | Barack Obama | 44% | John McCain | 47% | |
| Civitas Institute/ Tel Opinion Research |
July 14–16 | Barack Obama | 40% | John McCain | 43% | |
| Rasmussen Reports | July 15 | Barack Obama | 45% | John McCain | 48% | |
| Survey USA | July 12–14 | Barack Obama | 45% | John McCain | 50% | |
 North Dakota
3 electoral votes
(Republican in 2000 & 2004)
| North Dakota opinion polls | ||||||
|---|---|---|---|---|---|---|
| Poll Source | Date administered (2008) | Democrat | % | Republican | % | Lead Margin |
| Research 2000/Daily Kos | Oct 28–29 | Barack Obama | 46% | John McCain | 47% | |
| Research 2000/Daily Kos | Oct 14–15 | Barack Obama | 45% | John McCain | 45% | |
| The Bismarck Tribune | Oct 13–14 | Barack Obama | 44% | John McCain | 41% | |
| Minnesota State University/ Fargo Forum |
Oct 6–8 | Barack Obama | 45% | John McCain | 43% | |
| Research 2000/Daily Kos | Sept 16–17 | Barack Obama | 40% | John McCain | 53% | |
| American Research Group | Sept 15–17 | Barack Obama | 43% | John McCain | 52% | |
| Rasmussen Reports | Sept 8 | Barack Obama | 41% | John McCain | 55% | |
| North Dakota United Transportation Union/ DFM Research ** |
Aug 23–27 | Barack Obama | 43% | John McCain | 40% | |
| Research 2000/ Daily Kos |
July 21–23 | Barack Obama | 42% | John McCain | 45% | |
| Rasmussen Reports | July 8 | Barack Obama | 46% | John McCain | 47% | |
 Ohio
Ohio
20 electoral votes
(Republican in 2000 & 2004)
| Ohio opinion polls | ||||||||
|---|---|---|---|---|---|---|---|---|
| Poll Source | Date administered (2008) | Democrat | % | Republican | % | Lead Margin | Others | % |
| Reuters/Zogby | Oct 31 – Nov 3 | Barack Obama | 49.4% | John McCain | 47.4% | |||
| Rasmussen Reports | Nov 2 | Barack Obama | 49% | John McCain | 49% | |||
| Strategic Vision | Oct 31 – Nov 2 | Barack Obama | 46% | John McCain | 48% | |||
| Public Policy Polling | Oct 31 – Nov 2 | Barack Obama | 50% | John McCain | 48% | |||
| Reuters/Zogby | Oct 30 – Nov 2 | Barack Obama | 50.2% | John McCain | 43.9% | |||
| SurveyUSA | Oct 30 – Nov 2 | Barack Obama | 48% | John McCain | 46% | |||
| University of Cincinnati | Oct 29 – Nov 2 | Barack Obama | 51.5% | John McCain | 45.7% | |||
| Quinnipiac University | Oct 27 – Nov 2 | Barack Obama | 50% | John McCain | 43% | |||
| Columbus Dispatch | Oct 22–31 | Barack Obama | 52% | John McCain | 46% | |||
| Mason-Dixon | Oct 28–29 | Barack Obama | 45% | John McCain | 47% | |||
| CNN/Time Magazine/ Opinion Research |
Oct 23–28 | Barack Obama | 51% | John McCain | 47% | |||
| SurveyUSA | Oct 26–27 | Barack Obama | 49% | John McCain | 45% | |||
| Los Angeles Times/ Bloomberg |
Oct 25–27 | Barack Obama | 49% | John McCain | 40% | |||
| Allstate/National Journal/ FD |
Oct 23–27 | Barack Obama | 48% | John McCain | 41% | |||
| Rasmussen Reports/ Fox News |
Oct 26 | Barack Obama | 49% | John McCain | 45% | |||
| Marist College | Oct 24–26 | Barack Obama | 48% | John McCain | 45% | |||
| Reuters/Zogby | Oct 23–26 | Barack Obama | 49.7% | John McCain | 45.1% | |||
| Quinnipiac University | Oct 22–26 | Barack Obama | 51% | John McCain | 42% | |||
| AP/GfK | Oct 22–26 | Barack Obama | 48% | John McCain | 41% | |||
| Public Policy Polling | Oct 21–23 | Barack Obama | 51% | John McCain | 44% | |||
| Ohio University | Oct 12–23 | Barack Obama | 57% | John McCain | 41% | |||
| Politico/ InsiderAdvantage |
Oct 22 | Barack Obama | 52% | John McCain | 42% | |||
| Strategic Vision | Oct 20–22 | Barack Obama | 45% | John McCain | 48% | |||
| Big Ten Poll | Oct 19–22 | Barack Obama | 53% | John McCain | 41% | |||
| University of Cincinnati/ Ohio News Organization |
Oct 18–22 | Barack Obama | 49% | John McCain | 46% | |||
| CNN/Time Magazine/ Opinion Research |
Oct 19–21 | Barack Obama | 50% | John McCain | 46% | |||
| Quinnipiac University | Oct 16–21 | Barack Obama | 52% | John McCain | 38% | |||
| Rasmussen Reports/ Fox News |
Oct 19 | Barack Obama | 47% | John McCain | 49% | |||
| Suffolk University | Oct 16–19 | Barack Obama | 51% | John McCain | 42% | |||
| NBC/Mason-Dixon | Oct 16–17 | Barack Obama | 45% | John McCain | 46% | |||
| Rasmussen Reports | Oct 14 | Barack Obama | 49% | John McCain | 49% | |||
| SurveyUSA | Oct 12–13 | Barack Obama | 50% | John McCain | 45% | |||
| Rasmussen Reports/ Fox News |
Oct 12 | Barack Obama | 49% | John McCain | 47% | |||
| InsiderAdvantage/ PollPosition |
Oct 9 | Barack Obama | 49% | John McCain | 44% | |||
| Strategic Vision | Oct 6–8 | Barack Obama | 48% | John McCain | 46% | |||
| Marist College | Oct 5–8 | Barack Obama | 49% | John McCain | 45% | |||
| University of Cincinnati/ Ohio News Organization |
Oct 4–8 | Barack Obama | 46% | John McCain | 48% | |||
| American Research Group | Oct 4–7 | Barack Obama | 48% | John McCain | 45% | |||
| CNN/Time Magazine/ Opinion Research |
Oct 3–6 | Barack Obama | 50% | John McCain | 47% | |||
| Rasmussen Reports/ Fox News |
Oct 5 | Barack Obama | 47% | John McCain | 48% | |||
| Public Policy Polling | Oct 4–5 | Barack Obama | 49% | John McCain | 43% | |||
| ABC News/ Washington Post |
Oct 3–5 | Barack Obama | 51% | John McCain | 45% | |||
| Columbus Dispatch | Sept 24 – Oct 4 | Barack Obama | 49% | John McCain | 42% | |||
| Democracy Corps/ Greenberg Quinlan Rosner ** |
Sept 29 – Oct 1 | Barack Obama | 49% | John McCain | 43% | |||
| Insider Advantage/ PollPosition |
Sept 29 | Barack Obama | 47% | John McCain | 45% | |||
| SurveyUSA | Sept 28–29 | Barack Obama | 48% | John McCain | 49% | |||
| Quinnipiac University | Sept 27–29 | Barack Obama | 50% | John McCain | 42% | |||
| Rasmussen Reports/ Fox News |
Sept 28 | Barack Obama | 47% | John McCain | 48% | |||
| Rasmussen Reports | Sept 23 | Barack Obama | 46% | John McCain | 47% | |||
| InsiderAdvantage/ Poll Position |
Sept 22 | Barack Obama | 46% | John McCain | 46% | |||
| Rasmussen Reports/ Fox News |
Sept 21 | Barack Obama | 46% | John McCain | 50% | |||
| Big Ten Poll | Sept 14–17 | Barack Obama | 46% | John McCain | 45% | |||
| University of Cincinnati/ Ohio News Organization |
Sept 12–16 | Barack Obama | 42% | John McCain | 48% | |||
| Marist College | Sept 11–15 | Barack Obama | 47% | John McCain | 45% | |||
| Allstate/National Journal/ FD |
Sept 11–15 | Barack Obama | 41% | John McCain | 42% | |||
| Fox News/ Rasmussen Reports |
Sept 14 | Barack Obama | 45% | John McCain | 48% | |||
| CNN/Time Magazine/ Opinion Research |
Sept 13–14 | Barack Obama | 49% | John McCain | 47% | |||
| Public Policy Polling | Sept 13–14 | Barack Obama | 44% | John McCain | 48% | |||
| SurveyUSA | Sept 12–14 | Barack Obama | 45% | John McCain | 49% | |||
| American Research Group | Sept 10–13 | Barack Obama | 44% | John McCain | 50% | |||
| Suffolk University | Sept 10–13 | Barack Obama | 42% | John McCain | 46% | |||
| InsiderAdvantage/ Poll Position |
Sept 10 | Barack Obama | 47% | John McCain | 48% | |||
| University of Cincinnati | Sept 5–10 | Barack Obama | 44% | John McCain | 48% | Other | 5% | |
| Strategic Version | Sept 7–9 | Barack Obama | 44% | John McCain | 48% | |||
| Quinnipiac University | Sept 5–9 | Barack Obama | 49% | John McCain | 44% | |||
| Fox News/ Rasmussen Reports |
Sept 7 | Barack Obama | 44% | John McCain | 51% | |||
| CNN/Time Magazine/ Opinion Research |
Aug 31 – Sept 2 | Barack Obama | 47% | John McCain | 45% | |||
| Quinnipiac University | Aug 17–24 | Barack Obama | 44% | John McCain | 43% | |||
| The Columbus Dispatch | Aug 12–21 | Barack Obama | 41% | John McCain | 42% | |||
| Rasmussen Reports | Aug 20 | Barack Obama | 43% | John McCain | 48% | |||
| Public Policy Polling | Aug 12–14 | Barack Obama | 45% | John McCain | 45% | |||
| Quinnipiac University | July 23–29 | Barack Obama | 46% | John McCain | 44% | |||
| Rasmussen Reports | July 21 | Barack Obama | 42% | John McCain | 52% | |||
| Public Policy Polling | July 17–20 | Barack Obama | 48% | John McCain | 40% | |||
 Oklahoma
7 electoral votes
(Republican in 2000 & 2004)
| Oklahoma opinion polls | ||||||
|---|---|---|---|---|---|---|
| Poll Source | Date administered (2008) | Democrat | % | Republican | % | Lead Margin |
| SurveyUSA | Oct 28–29 | Barack Obama | 34% | John McCain | 63% | |
| TVPoll.com | Oct 24–26 | Barack Obama | 34.8% | John McCain | 61.8% | |
| SurveyUSA/KFOR-TV | Oct 18–19 | Barack Obama | 35% | John McCain | 59% | |
| TVPoll.com | Oct 10–12 | Barack Obama | 31.9% | John McCain | 63.0% | |
| TVPoll.com | Oct 4–5 | Barack Obama | 29.1% | John McCain | 65.5% | |
| SurveyUSA | Sept 28–29 | Barack Obama | 34% | John McCain | 64% | |
| TVPoll.com | Sept 26–28 | Barack Obama | 26.5% | John McCain | 67.6% | |
| TVPoll.com | Sept 20–22 | Barack Obama | 26.2% | John McCain | 65.8% | |
| Research 2000/Daily Kos | Sept 16–18 | Barack Obama | 36% | John McCain | 59% | |
| American Research Group | Sept 15–18 | Barack Obama | 34% | John McCain | 61% | |
| TVPoll.com | Sept 14 | Barack Obama | 26.9% | John McCain | 69.1% | |
| Rasmussen Reports | Sept 11 | Barack Obama | 32% | John McCain | 63% | |
| TVPoll.com | Sept 7 | Barack Obama | 27.9% | John McCain | 65.9% | |
| SurveyUSA | Sept 5–7 | Barack Obama | 32% | John McCain | 65% | |
| Sooner Poll/ Tulsa World |
July 19–23 | Barack Obama | 24% | John McCain | 56% | |
 Oregon
7 electoral votes
(Democrat in 2000 & 2004)
| Oregon opinion polls | ||||||
|---|---|---|---|---|---|---|
| Poll Source | Date administered (2008) | Democrat | % | Republican | % | Lead margin |
| Rasmussen Reports | Oct 30 | Barack Obama | 54% | John McCain | 42% | |
| SurveyUSA | Oct 29–30 | Barack Obama | 57% | John McCain | 38% | |
| Public Policy Polling | Oct 28–30 | Barack Obama | 57% | John McCain | 42% | |
| Research 2000/Daily Kos | Oct 27–29 | Barack Obama | 55% | John McCain | 39% | |
| SurveyUSA | Oct 25–26 | Barack Obama | 57% | John McCain | 38% | |
| Riley Research | Oct 10–20 | Barack Obama | 48% | John McCain | 34% | |
| Research 2000/ Daily Kos |
Oct 14–15 | Barack Obama | 53% | John McCain | 38% | |
| Rasmussen Reports | Oct 14 | Barack Obama | 54% | John McCain | 41% | |
| SurveyUSA | Oct 11–12 | Barack Obama | 57% | John McCain | 40% | |
| Grove Insight ** | Oct 7–9 | Barack Obama | 52% | John McCain | 39% | |
| Rasmussen Reports | Oct 9 | Barack Obama | 54% | John McCain | 43% | |
| Research 2000/Daily Kos | Sept 22–24 | Barack Obama | 53% | John McCain | 39% | |
| Survey USA | Sept 22–23 | Barack Obama | 52% | John McCain | 41% | |
| American Research Group | Sept 19–22 | Barack Obama | 52% | John McCain | 41% | |
| Rasmussen Reports | Sept 15 | Barack Obama | 51% | John McCain | 47% | |
| Portland Tribune/ Davis, Hibbitts & Midghall |
Sept 11–14 | Barack Obama | 50% | John McCain | 40% | |
| Hoffman Research Group ** | Sept 8–9 | Barack Obama | 46% | John McCain | 39% | |
| Rasmussen Reports | Aug 7 | Barack Obama | 52% | John McCain | 42% | |
| Survey USA | Aug 2–4 | Barack Obama | 48% | John McCain | 45% | |
| Rasmussen Reports | July 15 | Barack Obama | 49% | John McCain | 40% | |
 Pennsylvania
21 electoral votes
(Democrat in 2000 & 2004)
| Pennsylvania opinion polls | ||||||||
|---|---|---|---|---|---|---|---|---|
| Poll Source | Date administered (2008) | Democrat | % | Republican | % | Lead Margin | Others | % |
| SurveyUSA | Oct 31 – Nov 3 | Barack Obama | 52% | John McCain | 43% | |||
| Reuters/Zogby | Oct 31 – Nov 3 | Barack Obama | 51.2% | John McCain | 41.4% | |||
| Strategic Vision | Oct 31 – Nov 2 | Barack Obama | 51% | John McCain | 44% | |||
| Public Policy Polling | Oct 31 – Nov 2 | Barack Obama | 53% | John McCain | 45% | |||
| Reuters/Zogby | Oct 30 – Nov 2 | Barack Obama | 53.7% | John McCain | 40% | |||
| Muhlenberg College/ Morning Call |
Oct 29 – Nov 2 | Barack Obama | 52% | John McCain | 46% | |||
| Quinnipiac University | Oct 27 – Nov 2 | Barack Obama | 52% | John McCain | 42% | |||
| Rasmussen Reports | Nov 1 | Barack Obama | 52% | John McCain | 46% | |||
| SurveyUSA | Oct 29–31 | Barack Obama | 51% | John McCain | 44% | |||
| American Research Group | Oct 29–31 | Barack Obama | 51% | John McCain | 45% | |||
| Muhlenberg College/ Morning Call |
Oct 27–31 | Barack Obama | 52% | John McCain | 44% | |||
| Rasmussen Reports | Oct 30 | Barack Obama | 51% | John McCain | 47% | |||
| Muhlenberg College/ Morning Call |
Oct 26–30 | Barack Obama | 53% | John McCain | 43% | |||
| Mason-Dixon/NBC | Oct 28–29 | Barack Obama | 47% | John McCain | 43% | |||
| Strategic Vision | Oct 27–29 | Barack Obama | 49% | John McCain | 44% | |||
| Muhlenberg College/ Morning Call |
Oct 25–29 | Barack Obama | 53% | John McCain | 40% | |||
| NBC/Mason-Dixon | Oct 27–28 | Barack Obama | 47% | John McCain | 43% | |||
| CNN/Time Magazine/ Opinion Research |
Oct 23–28 | Barack Obama | 55% | John McCain | 43% | |||
| Rasmussen Reports | Oct 27 | Barack Obama | 53% | John McCain | 46% | |||
| Marist College | Oct 26–27 | Barack Obama | 55% | John McCain | 41% | |||
| Politico/ InsiderAdvantage |
Oct 26 | Barack Obama | 51% | John McCain | 42% | |||
| Quinnipiac University | Oct 22–26 | Barack Obama | 53% | John McCain | 41% | |||
| Associated Press/GfK | Oct 22–26 | Barack Obama | 52% | John McCain | 40% | |||
| Muhlenberg College/ Morning Call |
Oct 22–26 | Barack Obama | 53% | John McCain | 40% | |||
| Franklin & Marshall College | Oct 21–26 | Barack Obama | 53% | John McCain | 40% | |||
| Temple University | Oct 20–26 | Barack Obama | 50% | John McCain | 41% | |||
| Muhlenberg College/ Morning Call |
Oct 19–23 | Barack Obama | 52% | John McCain | 40% | |||
| Strategic Vision | Oct 20–22 | Barack Obama | 50% | John McCain | 43% | |||
| Big Ten Poll | Oct 19–22 | Barack Obama | 52% | John McCain | 41% | |||
| SurveyUSA | Oct 21 | Barack Obama | 53% | John McCain | 41% | |||
| Quinnipiac University | Oct 16–21 | Barack Obama | 53% | John McCain | 40% | |||
| National Journal/FD | Oct 16–20 | Barack Obama | 51% | John McCain | 41% | |||
| Muhlenberg College/ Morning Call |
Oct 15–19 | Barack Obama | 53% | John McCain | 41% | |||
| Susquehanna Polling and Research/ Pittsburgh Tribune-Review |
Oct 16–18 | Barack Obama | 48% | John McCain | 40% | |||
| Muhlenberg College/ Morning Call |
Oct 11–15 | Barack Obama | 53% | John McCain | 37% | |||
| SurveyUSA | Oct 11–13 | Barack Obama | 55% | John McCain | 40% | |||
| Marist College | Oct 5–8 | Barack Obama | 53% | John McCain | 41% | |||
| Strategic Vision | Oct 5–7 | Barack Obama | 54% | John McCain | 40% | |||
| Muhlenberg College/ Morning Call |
Oct 3–7 | Barack Obama | 50% | John McCain | 38% | |||
| Rasmussen Reports | Oct 6 | Barack Obama | 54% | John McCain | 41% | |||
| SurveyUSA | Oct 5–6 | Barack Obama | 55% | John McCain | 40% | |||
| Muhlenberg College/ Morning Call |
Oct 1–5 | Barack Obama | 49% | John McCain | 38% | |||
| Muhlenberg College/ Morning Call |
Sept 30- October 3 |
Barack Obama | 51% | John McCain | 39% | |||
| Muhlenberg College/ Morning Call |
Sept 27- October 1 |
Barack Obama | 50% | John McCain | 41% | |||
| Quinnipiac University | Sept 27–29 | Barack Obama | 54% | John McCain | 39% | |||
| Muhlenberg College/ Morning Call |
Sept 25–29 | Barack Obama | 49% | John McCain | 41% | |||
| Rasmussen Reports/ Fox News |
Sept 28 | Barack Obama | 50% | John McCain | 42% | |||
| Muhlenberg College/ Morning Call |
Sept 24–28 | Barack Obama | 49% | John McCain | 42% | |||
| Franklin & Marshall | Sept 23–28 | Barack Obama | 45% | John McCain | 38% | |||
| Rasmussen Reports | Sept 24 | Barack Obama | 49% | John McCain | 45% | |||
| SurveyUSA | Sept 23–24 | Barack Obama | 50% | John McCain | 44% | |||
| Muhlenberg College/ Morning Call |
Sept 21–24 | Barack Obama | 47% | John McCain | 43% | |||
| CNN/Time Magazine/ Opinion Research |
Sept 21–23 | Barack Obama | 51% | John McCain | 43% | Bob Barr | 1% | |
| Ralph Nader | 3% | |||||||
| American Research Group | Sept 20–22 | Barack Obama | 50% | John McCain | 46% | |||
| Strategic Vision | Sept 20–22 | Barack Obama | 47% | John McCain | 46% | |||
| Allstate/National Journal/FD | Sept 18–22 | Barack Obama | 43% | John McCain | 41% | |||
| Fox News/ Rasmussen Reports |
Sept 21 | Barack Obama | 48% | John McCain | 45% | |||
| NBC/Mason-Dixon | Sept 16–18 | Barack Obama | 46% | John McCain | 44% | |||
| Big Ten Poll | Sept 14–17 | Barack Obama | 45% | John McCain | 45% | |||
| Marist College | Sept 11–15 | Barack Obama | 49% | John McCain | 44% | |||
| Fox News/ Rasmussen Reports |
Sept 14 | Barack Obama | 47% | John McCain | 47% | |||
| Quinnipiac University | Sept 5–9 | Barack Obama | 48% | John McCain | 45% | |||
| Fox News/ Rasmussen Reports |
Sept 8 | Barack Obama | 47% | John McCain | 45% | |||
| Strategic Vision | Sept 5–7 | Barack Obama | 47% | John McCain | 45% | |||
| CNN/Time Magazine/ Opinion Research |
Aug 24–26 | Barack Obama | 48% | John McCain | 43% | |||
| Quinnipiac University | Aug 17–24 | Barack Obama | 49% | John McCain | 42% | |||
| Rasmussen Reports | Aug 19 | Barack Obama | 48% | John McCain | 45% | |||
| Susquehanna Polling & Research |
Aug 11–14 | Barack Obama | 46% | John McCain | 41% | |||
| Franklin & Marshall College | Aug 4–10 | Barack Obama | 46% | John McCain | 41% | |||
| Quinnipiac University | July 23–29 | Barack Obama | 49% | John McCain | 42% | |||
| Strategic Vision | July 25–27 | Barack Obama | 49% | John McCain | 40% | |||
| Rasmussen Reports | July 23 | Barack Obama | 51% | John McCain | 45% | |||
 Rhode Island
4 electoral votes
(Democrat in 2000 & 2004)
| Rhode Island opinion polls | ||||||
|---|---|---|---|---|---|---|
| Poll Source | Date administered (2008) | Democrat | % | Republican | % | Lead Margin |
| Rhode Island College | Sept 17–24 | Barack Obama | 47% | John McCain | 34% | |
| Brown University | Sept 15–16 | Barack Obama | 47% | John McCain | 34% | |
| Rasmussen Reports | Sept 13 | Barack Obama | 58% | John McCain | 39% | |
| American Research Group | Sept 11–13 | Barack Obama | 59% | John McCain | 33% | |
| Brown University | Aug 18–20 | Barack Obama | 50% | John McCain | 30% | |
 South Carolina
8 electoral votes
(Republican in 2000 & 2004)
| South Carolina opinion polls | ||||||
|---|---|---|---|---|---|---|
| Poll Source | Date administered (2008) | Democrat | % | Republican | % | Lead Margin |
| Survey USA | Oct 28–29 | Barack Obama | 44% | John McCain | 52% | |
| NBC/Princeton Survey Research |
Oct 25–28 | Barack Obama | 42% | John McCain | 53% | |
| Rasmussen Reports | Oct 20 | Barack Obama | 43% | John McCain | 54% | |
| Winthrop University/ETV | Sept 28 – Oct 19 | Barack Obama | 34.9% | John McCain | 55.1% | |
| Survey USA | Oct 12–13 | Barack Obama | 41% | John McCain | 55% | |
| Research 2000/Daily Kos | Sept 22–24 | Barack Obama | 39% | John McCain | 54% | |
| Survey USA | Sept 21–22 | Barack Obama | 39% | John McCain | 58% | |
| Rasmussen Reports | Sept 18 | Barack Obama | 45% | John McCain | 51% | |
| American Research Group | Sept 14–17 | Barack Obama | 37% | John McCain | 59% | |
| Research 2000/Daily Kos | July 22–23 | Barack Obama | 40% | John McCain | 53% | |
| Public Policy Polling | July 9–11 | Barack Obama | 39% | John McCain | 45% | |
 South Dakota
3 electoral votes
(Republican in 2000 & 2004)
| South Dakota opinion polls | ||||||
|---|---|---|---|---|---|---|
| Poll Source | Date administered (2008) | Democrat | % | Republican | % | Lead Margin |
| Rasmussen Reports | Oct 30 | Barack Obama | 44% | John McCain | 53% | |
| Research 2000/Daily Kos | Oct 22–24 | Barack Obama | 41% | John McCain | 50% | |
| Argus Leader Media/KELO-TV | Oct 13–15 | Barack Obama | 41% | John McCain | 48% | |
| American Research Group | Sept 19–21 | Barack Obama | 39% | John McCain | 55% | |
| Rasmussen Reports | Sept 9 | Barack Obama | 37% | John McCain | 54% | |
| Rasmussen Reports | July 9 | Barack Obama | 43% | John McCain | 47% | |
 Tennessee
11 electoral votes
(Republican in 2000 & 2004)
| Tennessee opinion polls | ||||||
|---|---|---|---|---|---|---|
| Poll Source | Date administered (2008) | Democrat | % | Republican | % | Lead Margin |
| Research 2000/Daily Kos | Oct 21–22 | Barack Obama | 38% | John McCain | 54% | |
| Rasmussen Reports | Oct 16 | Barack Obama | 42% | John McCain | 54% | |
| Rasmussen Reports | Sept 29 | Barack Obama | 39% | John McCain | 58% | |
| Middle Tennessee State University | Sept 15–27 | Barack Obama | 36% | John McCain | 48% | |
| Mason-Dixon | Sept 22–24 | Barack Obama | 39% | John McCain | 55% | |
| American Research Group | Sept 16–19 | Barack Obama | 36% | John McCain | 59% | |
| Rasmussen Reports | Aug 20 | Barack Obama | 35% | John McCain | 60% | |
| Ayres, McHenry & Associates ** | Aug 10–12 | Barack Obama | 36% | John McCain | 51% | |
 Texas
Texas
34 electoral votes
(Republican in 2000 & 2004)
| Texas opinion polls | ||||||
|---|---|---|---|---|---|---|
| Poll Source | Date administered (2008) | Democrat | % | Republican | % | Lead Margin |
| University of Texas | Oct 15–22 | Barack Obama | 40% | John McCain | 51% | |
| Rasmussen Reports | Oct 21 | Barack Obama | 44% | John McCain | 54% | |
| Research 2000/Daily Kos | Oct 14–15 | Barack Obama | 40% | John McCain | 52% | |
| American Research Group | Oct 5–8 | Barack Obama | 38% | John McCain | 57% | |
| Rasmussen Reports | Sept 29 | Barack Obama | 43% | John McCain | 52% | |
| American Research Group | Sept 13–16 | Barack Obama | 36% | John McCain | 57% | |
| Rasmussen Reports | Aug 21 | Barack Obama | 44% | John McCain | 54% | |
| University of Texas | July 18–30 | Barack Obama | 33% | John McCain | 43% | |
| Rasmussen Reports | July 29 | Barack Obama | 44% | John McCain | 52% | |
 Utah
Utah
5 electoral votes
(Republican in 2000 & 2004)
| Utah opinion polls | ||||||
|---|---|---|---|---|---|---|
| Poll Source | Date administered (2008) | Democrat | % | Republican | % | Lead Margin |
| Deseret News/KSL-TV Dan Jones & Associates |
Oct 24–30 | Barack Obama | 32% | John McCain | 57% | |
| American Research Group | Sept 10–13 | Barack Obama | 29% | John McCain | 65% | |
| Rasmussen Reports | Sept 10 | Barack Obama | 32% | John McCain | 64% | |
| Deseret News/ Dan Jones & Associates |
Sept 8–11 | Barack Obama | 24% | John McCain | 62% | |
| Mason Dixon | Aug 13–15 | Barack Obama | 23% | John McCain | 62% | |
 Vermont
Winner: Barack Obama
3 electoral votes
(Democrat in 2000 & 2004)
| Vermont opinion polls | ||||||
|---|---|---|---|---|---|---|
| Poll Source | Date administered (2008) | Democrat | % | Republican | % | Lead Margin |
| Rasmussen Reports | Oct 6 | Barack Obama | 65% | John McCain | 32% | |
| American Research Group | Sept 18–22 | Barack Obama | 56% | John McCain | 38% | |
| Research 2000 | Sept 14 | Barack Obama | 55% | John McCain | 36% | |
| Rasmussen Reports | Sept 13 | Barack Obama | 60% | John McCain | 36% | |
 Virginia
13 electoral votes
(Republican in 2000 & 2004)
| Virginia opinion polls | ||||||
|---|---|---|---|---|---|---|
| Poll Source | Date administered (2008) | Democrat | % | Republican | % | Lead Margin |
| American Research Group | Oct 31 – Nov 3 | Barack Obama | 51% | John McCain | 47% | |
| Reuters/Zogby | Oct 31 – Nov 3 | Barack Obama | 51.7% | John McCain | 45.3% | |
| Rasmussen Reports/ Fox News |
Nov 2 | Barack Obama | 51% | John McCain | 47% | |
| Public Policy Polling | Oct 31 – Nov 2 | Barack Obama | 52% | John McCain | 46% | |
| Reuters/Zogby | Oct 30 – Nov 2 | Barack Obama | 50.7% | John McCain | 44.6% | |
| SurveyUSA | Oct 30 – Nov 1 | Barack Obama | 50% | John McCain | 46% | |
| Mason-Dixon/ Richmond Times-Dispatch |
Oct 29–30 | Barack Obama | 47% | John McCain | 44% | |
| CNN/Time Magazine/ Opinion Research |
Oct 23–28 | Barack Obama | 53% | John McCain | 44% | |
| Marist College | Oct 26–27 | Barack Obama | 51% | John McCain | 47% | |
| Allstate/National Journal/FD | Oct 23–27 | Barack Obama | 48% | John McCain | 44% | |
| Rasmussen Reports/ Fox News |
Oct 26 | Barack Obama | 51% | John McCain | 47% | |
| SurveyUSA | Oct 25–26 | Barack Obama | 52% | John McCain | 43% | |
| Reuters/Zogby | Oct 23–26 | Barack Obama | 52% | John McCain | 44.8% | |
| Associated Press/GfK | Oct 22–26 | Barack Obama | 49% | John McCain | 42% | |
| Roanoke College | Oct 19–26 | Barack Obama | 48% | John McCain | 39% | |
| News/ Washington Post |
Oct 22–25 | Barack Obama | 52% | John McCain | 44% | |
| Public Policy Polling | Oct 21–23 | Barack Obama | 51% | John McCain | 43% | |
| Virginia Commonwealth University |
Oct 20–22 | Barack Obama | 51% | John McCain | 40% | |
| NBC/Mason-Dixon | Oct 20–21 | Barack Obama | 47% | John McCain | 45% | |
| CNN/Time Magazine/ Opinion Research |
Oct 19–21 | Barack Obama | 54% | John McCain | 44% | |
| SurveyUSA | Oct 18–19 | Barack Obama | 51% | John McCain | 45% | |
| Winthrop University/ETV | Sept 28 – Oct 19 | Barack Obama | 44.6% | John McCain | 43.6% | |
| Rasmussen Reports | Oct 16 | Barack Obama | 54% | John McCain | 44% | |
| CNN/Time Magazine/ Opinion Research |
Oct 11–14 | Barack Obama | 53% | John McCain | 43% | |
| Christopher Newport University |
Oct 11–14 | Barack Obama | 49.2% | John McCain | 43.2% | |
| Rasmussen Reports/ Fox News |
Oct 12 | Barack Obama | 50% | John McCain | 47% | |
| Public Policy Polling | Oct 6–7 | Barack Obama | 51% | John McCain | 43% | |
| Rasmussen Reports/ Fox News |
Oct 5 | Barack Obama | 50% | John McCain | 48% | |
| SurveyUSA | Oct 4–5 | Barack Obama | 53% | John McCain | 43% | |
| Suffolk University | Oct 3–5 | Barack Obama | 51% | John McCain | 39% | |
| Mason-Dixon/ Richmond Times-Dispatch |
Sept 28 – Oct 1 | Barack Obama | 45% | John McCain | 48% | |
| CNN/Time Magazine/ Opinion Research |
Sept 28- 30 | Barack Obama | 53% | John McCain | 44% | |
| Insider Advantage/ Poll Position |
Sept 29 | Barack Obama | 51% | John McCain | 45% | |
| American Research Group | Sept 27–29 | Barack Obama | 46% | John McCain | 49% | |
| Rasmussen Reports/ Fox News |
Sept 28 | Barack Obama | 50% | John McCain | 47% | |
| Rasmussen Reports | Sept 25 | Barack Obama | 50% | John McCain | 45% | |
| NBC/Mason-Dixon | Sept 17- 22 | Barack Obama | 44% | John McCain | 47% | |
| Rasmussen Reports/ Fox News |
Sept 21 | Barack Obama | 48% | John McCain | 50% | |
| SurveyUSA | Sept 19- 21 | Barack Obama | 51% | John McCain | 45% | |
| ABC News/ Washington Post |
Sept 18- 21 | Barack Obama | 49% | John McCain | 46% | |
| American Research Group | Sept 17- 20 | Barack Obama | 46% | John McCain | 48% | |
| Insider Advantage/ Poll Position |
Sept 17 | Barack Obama | 46% | John McCain | 48% | |
| Allstate/National Journal/FD | Sept 11–15 | Barack Obama | 41% | John McCain | 48% | |
| Fox News/ Rasmussen Reports |
Sept 14 | Barack Obama | 48% | John McCain | 48% | |
| Public Policy Polling | Sept 13–14 | Barack Obama | 48% | John McCain | 46% | |
| SurveyUSA | Sept 12–14 | Barack Obama | 50% | John McCain | 46% | |
| Christopher Newport University |
Sept 10–14 | Barack Obama | 39% | John McCain | 48% | |
| CNN/Time Magazine/ Opinion Research |
Sept 9 | Barack Obama | 43% | John McCain | 49% | |
| Fox News/ Rasmussen Reports |
Sept 7 | Barack Obama | 47% | John McCain | 49% | |
| SurveyUSA | Sept 5–7 | Barack Obama | 47% | John McCain | 49% | |
| Public Policy Polling | Aug 20–22 | Barack Obama | 47% | John McCain | 45% | |
| InsiderAdvantage/ Majority Opinion Research |
Aug 12 | Barack Obama | 42.6% | John McCain | 43.1% | |
| Rasmussen Reports | Aug 12 | Barack Obama | 47% | John McCain | 48% | |
| SurveyUSA | Aug 8–10 | Barack Obama | 47% | John McCain | 48% | |
| Public Policy Polling | July 17–20 | Barack Obama | 46% | John McCain | 44% | |
| Rasmussen Reports | July 16 | Barack Obama | 47% | John McCain | 48% | |
 Washington
11 electoral votes
(Democrat in 2000 & 2004)
| Washington opinion polls | ||||||
|---|---|---|---|---|---|---|
| Poll Source | Date administered (2008) | Democrat | % | Republican | % | Lead Margin |
| Strategic Vision | Oct 31 – Nov 2 | Barack Obama | 55% | John McCain | 40% | |
| SurveyUSA | Oct 30 – Nov 2 | Barack Obama | 56% | John McCain | 40% | |
| The Washington Poll/ Pacific Market Research |
Oct 27–31 | Barack Obama | 51% | John McCain | 39% | |
| SurveyUSA | Oct 26–27 | Barack Obama | 56% | John McCain | 39% | |
| Strategic Vision | Oct 25–26 | Barack Obama | 54% | John McCain | 42% | |
| The Washington Poll/ Pacific Market Research |
Oct 18–26 | Barack Obama | 55% | John McCain | 34% | |
| Rasmussen Reports | Oct 22 | Barack Obama | 54% | John McCain | 43% | |
| Elway Poll | Oct 16–19 | Barack Obama | 55% | John McCain | 36% | |
| SurveyUSA | Oct 12–13 | Barack Obama | 56% | John McCain | 40% | |
| Rasmussen Reports | Oct 2 | Barack Obama | 53% | John McCain | 43% | |
| SurveyUSA | Sept 21–22 | Barack Obama | 54% | John McCain | 43% | |
| American Research Group | Sept 16–18 | Barack Obama | 50% | John McCain | 44% | |
| Strategic Vision | Sept 14–16 | Barack Obama | 47% | John McCain | 42% | |
| Rasmussen Reports | Sept 10 | Barack Obama | 49% | John McCain | 47% | |
| Elway Poll | Sept 6–8 | Barack Obama | 46% | John McCain | 37% | |
| SurveyUSA | Sept 5–7 | Barack Obama | 49% | John McCain | 45% | |
| SurveyUSA | Aug 11–12 | Barack Obama | 51% | John McCain | 44% | |
| Rasmussen Reports | Aug 6 | Barack Obama | 54% | John McCain | 42% | |
| Elway Poll | July 27–31 | Barack Obama | 47% | John McCain | 35% | |
| Strategic Vision | July 25–27 | Barack Obama | 48% | John McCain | 37% | |
| SurveyUSA | July 13–15 | Barack Obama | 55% | John McCain | 39% | |
| Moore Information | July 9–10 | Barack Obama | 47% | John McCain | 37% | |
| Rasmussen Reports | July 9 | Barack Obama | 51% | John McCain | 43% | |
 West Virginia
5 electoral votes
(Republican in 2000 & 2004)
| West Virginia opinion polls | ||||||
|---|---|---|---|---|---|---|
| Poll Source | Date administered (2008) | Democrat | % | Republican | % | Lead Margin |
| American Research Group |
Oct 31 – Nov 3 | Barack Obama | 42% | John McCain | 53% | |
| Public Policy Polling | Oct 29–30 | Barack Obama | 42% | John McCain | 55% | |
| Reuters/Zogby | Oct 23–26 | Barack Obama | 40.4% | John McCain | 50.3% | |
| Research 2000/ Daily Kos |
Oct 22–24 | Barack Obama | 43% | John McCain | 49% | |
| Wesleyan College/ The State Journal |
Oct 20–21 | Barack Obama | 43.5% | John McCain | 49.2% | |
| CNN/Time Magazine/ Opinion Research |
Oct 19–21 | Barack Obama | 44% | John McCain | 53% | |
| Rasmussen Reports | Oct 20 | Barack Obama | 43% | John McCain | 52% | |
| NBC/Mason-Dixon | Oct 16–17 | Barack Obama | 41% | John McCain | 47% | |
| Public Policy Polling | Oct 16–17 | Barack Obama | 42% | John McCain | 50% | |
| Rainmaker Media Group | Oct 14–15 | Barack Obama | 41% | John McCain | 42% | |
| InsiderAdvantage/ Poll Position |
Oct 13 | Barack Obama | 47% | John McCain | 49% | |
| American Research Group |
Oct 4–8 | Barack Obama | 50% | John McCain | 42% | |
| Rasmussen Reports | Sept 24 | Barack Obama | 42% | John McCain | 50% | |
| CNN/Time Magazine/ Opinion Research |
Sept 21–23 | Barack Obama | 44% | John McCain | 49% | |
| American Research Group |
Sept 14–16 | Barack Obama | 45% | John McCain | 49% | |
| Mark Blankenship Enterprises |
Sept 6–7 | Barack Obama | 39% | John McCain | 44% | |
 Wisconsin
10 electoral votes
(Democrat in 2000 & 2004)
| Wisconsin opinion polls | ||||||
|---|---|---|---|---|---|---|
| Poll Source | Date administered (2008) | Democrat | % | Republican | % | Lead Margin |
| Strategic Vision | Oct 31 – Nov 2 | Barack Obama | 53% | John McCain | 40% | |
| SurveyUSA | Oct 28–29 | Barack Obama | 55% | John McCain | 39% | |
| Research 2000/ WISC-TV |
Oct 27–28 | Barack Obama | 53% | John McCain | 42% | |
| UW Badger Poll | Oct 21–28 | Barack Obama | 52% | John McCain | 42% | |
| Strategic Vision | Oct 24–26 | Barack Obama | 50% | John McCain | 41% | |
| Rasmussen Reports | Oct 23 | Barack Obama | 51% | John McCain | 44% | |
| Big Ten Poll | Oct 19–22 | Barack Obama | 53% | John McCain | 40% | |
| Research 2000/ WISC-TV |
Oct 20–21 | Barack Obama | 52% | John McCain | 41% | |
| National Journal/FD | Oct 16–20 | Barack Obama | 53% | John McCain | 40% | |
| SurveyUSA | Oct 18–19 | Barack Obama | 51% | John McCain | 43% | |
| NBC/Mason-Dixon | Oct 16–17 | Barack Obama | 51% | John McCain | 39% | |
| Wisconsin Public Radio/ St Norbert College |
Oct 9–17 | Barack Obama | 51% | John McCain | 38% | |
| University of Wisconsin-Milwaukee |
Oct 8–15 | Barack Obama | 51% | John McCain | 36% | |
| Quinnipiac University/ Wall Street Journal/ Washington Post |
Oct 8–12 | Barack Obama | 54% | John McCain | 37% | |
| Rasmussen Reports | Oct 6 | Barack Obama | 54% | John McCain | 44% | |
| Research 2000 | Oct 5–6 | Barack Obama | 51% | John McCain | 41% | |
| SurveyUSA | Oct 5–6 | Barack Obama | 52% | John McCain | 42% | |
| CNN/Time Magazine/ Opinion Research |
Oct 3–6 | Barack Obama | 51% | John McCain | 46% | |
| Strategic Vision | Sept 22–26 | Barack Obama | 49% | John McCain | 40% | |
| WISC-TV/Research 2000 | Sept 23–24 | Barack Obama | 49% | John McCain | 43% | |
| American Research Group | Sept 18–21 | Barack Obama | 50% | John McCain | 45% | |
| Quinnipiac University/ Wall Street Journal/ Washington Post |
Sept 14–21 | Barack Obama | 49% | John McCain | 42% | |
| Big Ten Poll | Sept 14–17 | Barack Obama | 45% | John McCain | 44% | |
| CNN/Time Magazine/ Opinion Research |
Sept 14–16 | Barack Obama | 50% | John McCain | 47% | |
| Rasmussen Reports | Sept 15 | Barack Obama | 48% | John McCain | 46% | |
| Strategic Vision | Sept 5–7 | Barack Obama | 46% | John McCain | 43% | |
| Strategic Vision | Aug 8–10 | Barack Obama | 47% | John McCain | 42% | |
| Rasmussen Reports | Aug 5 | Barack Obama | 51% | John McCain | 44% | |
| Wisconsin Policy Research Institute |
Aug 3–4 | Barack Obama | 44% | John McCain | 38% | |
| Quinnipiac University/ Wall Street Journal/ Washington Post |
July 14–22 | Barack Obama | 50% | John McCain | 39% | |
| Rasmussen Reports | July 8 | Barack Obama | 52% | John McCain | 42% | |
 Wyoming
3 electoral votes
(Republican in 2000 & 2004)
| Wyoming opinion polls | ||||||
|---|---|---|---|---|---|---|
| Poll Source | Date administered (2008) | Democrat | % | Republican | % | Lead Margin |
| Research 2000/Daily Kos | Oct 27–29 | Barack Obama | 36% | John McCain | 61% | |
| SurveyUSA/Roll Call | Oct 18–19 | Barack Obama | 37% | John McCain | 58% | |
| Research 2000/Daily Kos | Oct 14–16 | Barack Obama | 35% | John McCain | 58% | |
| Research 2000/Daily Kos | Sept 22–24 | Barack Obama | 36% | John McCain | 57% | |
| American Research Group | Sept 9-11 | Barack Obama | 28% | John McCain | 66% | |
| Rasmussen Reports | Sept 10 | Barack Obama | 39% | John McCain | 58% | |
| Mason Dixon | Aug 13–15 | Barack Obama | 25% | John McCain | 62% | |
See also
- Nationwide opinion polling for the Democratic Party 2008 presidential candidates
- Nationwide opinion polling for the Republican Party 2008 presidential candidates
- Nationwide opinion polling for the United States presidential election, 2008
- Statewide opinion polling for the Democratic Party presidential primaries, 2008
- Statewide opinion polling for the Republican Party presidential primaries, 2008
Notes
- * a scientific poll conducted via the Internet (not used in calculating results below).
- ** a poll commissioned by an organization affiliated with a specific candidate (not used in calculating results below).
Latest results (using latest polling when available)
This results section uses only the latest polls for each state. It is for indicative purposes only, and is highly susceptible to polling errors. The numbers in parentheses indicate the number of electoral votes awarded to each state. A total of 538 electoral votes are distributed among the states and DC. Margins of 10% or more are considered "safe"; margins of 5% to 9.9% are considered "likely" and margins of 0.1% to 4.9% are considered "leaning". Margins of multiple polls concluded the same day are averaged out. Because the list is revised after newer polls are released, it is highly volatile and should only be taken as examples.
|
|
Tied
|
Maps of recent polling data
Map and totals updated at 11-3-08 11:10AM EST. Maps are based on a weighted average for the previous 10 polling results, and as such may be slow to show changes in countrywide opinion – click on the image to view its history. The second map is altered to convey the proportional amount of electoral votes of each state. The number of electoral votes of a given state is based on its population. Candidates must win at least 270 electoral votes to win the election, and the House of Representatives votes in the event no one qualifies.


| Safe Obama – over 10% (243) | Likely Obama – over 5% (291) (48) | Leans Obama – over 1% (338) (47) | Tossup – within 1% (29) | Leans McCain – over 1% (171) (39) | Likely McCain – over 5% (132) (14) | Safe McCain – over 10% (118) |
| District of Columbia (3) – 69.0% Hawaii (4) – 38.3% |
Pennsylvania (21) – 7.4%
Colorado (9) – 7.2% |
Ohio (20) – 4.6% Florida (27) – 3.1% |
North Carolina (15) – 0.9% Obama Missouri (11) – 0.1% McCain |
Arizona (10) – 4.7% Georgia (15) – 4.1% |
Arkansas (6) – 9.7% South Dakota (3) – 9.0% |
Oklahoma (7) – 29.3% Utah (5) – 26.2% |
Totals
- Obama leads: 338 electoral votes
- McCain leads: 171 electoral votes
Election Day projection
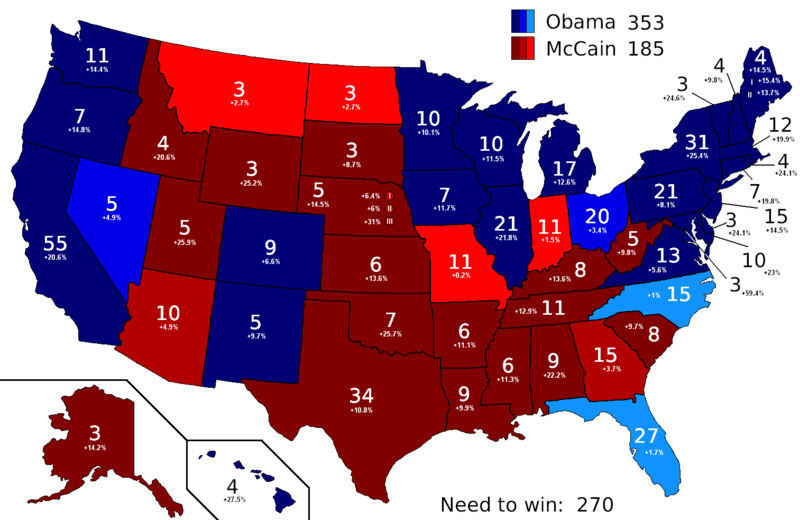
FINAL UPDATE: 22:32, 4 November 2008 (UTC)
- Data derived from Nate Silver's FiveThirtyEight.com weighted averages and statistical polling analysis, which determines what the best guess as to what will happen on Election Day is rather than what would happen if the election were held today. (Methodology)
- Each state is colored according to which candidate is currently projected to win, and both the state's total electoral votes and the winning candidate's projected margin of victory are listed.
References
- ↑ "Poll: Obama Leading McCain In Mich – Politics News Story – WDIV Detroit". Clickondetroit.com. Retrieved 2008-09-05.
External links
- FiveThirtyEight.com: Detailed analysis of state-by-state general election polling
- Electoral-Vote.com
- Pollster.com Graphic display of aggregated polls
- Election-Projection.net 2008 state-by-state and Electoral College Vote Projections
- Rasmussen Reports: Balance of Power Calculator
- Real Clear Politics
- Princeton Election Consortium
- Survey USA
- CNN's Electoral Map
- American Research Group's Ballot Lead Calculator
