List of third party performances in United States presidential elections
This is a list of third party performances in United States presidential elections.
In the United States it is rare for third party and independent candidates, other than those of the six parties which have succeded as major parties (Federalist Party, Democratic-Republican Party, National Republican Party, Democratic Party, Whig Party, Republican Party), to take large shares of the vote in elections.
Occasionally, a third party becomes one of the two major parties through a presidential election (the last time it happened was in 1856, when the Republicans supplanted the Whigs, who had withered and endorsed the ticket of the American Party): such an election is called a realigning election, as it causes a realignment in the party system; according to scholars, there have been six party systems so far. Only once one of the two major parties came third in an election, but that did not cause a realignment (in 1912 the Progressive Party surpassed the Republicans, but the party quickly disappeared and the Republicans re-gained their major party status).
In the 58 presidential elections since 1788, third party or independent candidates have won at least 5.0% of the vote or garnered electoral votes 12 times (21%); this does not count George Washington, who was elected as an independent in 1788–1789 and 1792, but who largerly supported Federalist policies and was supported by Federalists. The last third party candidate to win electoral votes was George Wallace of the American Independent Party in 1968, while the last third party candidate to win more than 5.0% of the vote was Ross Perot, who ran as an independent and as the standard-bearer of the Reform Party in 1992 and 1996, respectively. The most recent third party candidate to receive an electoral vote was Libertarian John Hospers, who received a vote from a faithless elector in Virginia.
Major third party performances (1788–present)
The list includes the third party candidates that captured at least 1 electoral vote and/or more than 5% of the popular vote.
| Year | Party | Nominee | Running-Mate | # Votes | % Votes | % Votes On Ballot |
Electoral Votes | Place | Notes |
|---|---|---|---|---|---|---|---|---|---|
| 1832 | Nullifier | John Floyd | Henry Lee | 0[1] | 0 / 100 |
N/A[1] | 11 / 286 |
3rd | |
| Anti-Masonic | William Wirt | Amos Ellmaker | 99,817 | 7.78 / 100 |
15.93 / 100 |
7 / 286 |
4th | ||
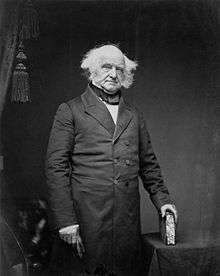
| 1848 | Free Soil | Martin Van Buren | Charles F. Adams | 291,475 | 10.13 / 100 |
13.79 / 100 |
0 / 290 |
3rd | |
| 1856 | American | Millard Fillmore | Andrew J. Donelson | 872,703 | 21.54 / 100 |
21.54 / 100 |
8 / 296 |
3rd | |
| 1860 | Constitutional Democratic | John C. Breckinridge | Joseph Lane | 851,844 | 18.20 / 100 |
22.04 / 100 |
72 / 303 |
2nd | |
| Constitutional Union | John Bell | Edward Everett | 590,946 | 12.62 / 100 |
15.43 / 100 |
39 / 303 |
3rd | ||
| 1892 | Populist | James B. Weaver | James G. Field | 1,026,595 | 8.51 / 100 |
8.62 / 100 |
22 / 444 |
3rd | |
| 1912 | Progressive | Theodore Roosevelt | Hiram Johnson | 4,120,609 | 27.39 / 100 |
27.86 / 100 |
88 / 531 |
2nd | |
| Socialist | Eugene V. Debs | Emil Seidel | 900,742 | 5.99 / 100 |
5.99 / 100 |
0 / 531 |
4th | ||
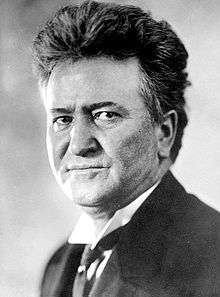
| 1924 | Progressive | Robert M. La Follette | Burton K. Wheeler | 4,833,821 | 16.62 / 100 |
16.69 / 100 |
13 / 531 |
3rd | |
| 1948 | States' Rights Democratic | Strom Thurmond | Fielding L. Wright | 1,175,946 | 2.41 / 100 |
17.70 / 100 |
39 / 531 |
3rd | |
| 1968 | American Independent | George Wallace | Curtis LeMay | 9,901,118 | 13.53 / 100 |
13.56 / 100 |
46 / 538 |
3rd | |
| 1980 | Independent | John B. Anderson | Patrick Lucey | 5,719,850 | 6.61 / 100 |
6.61 / 100 |
0 / 538 |
3rd | |
| 1992 | Independent | Ross Perot | James Stockdale | 19,743,821 | 18.91 / 100 |
18.91 / 100 |
0 / 538 |
3rd | |
| 1996 | Reform | Pat Choate | 8,085,402 | 8.40 / 100 |
8.40 / 100 |
0 / 538 |
3rd | ||
Other third party performances (1788–present)
The list includes the third party candidates that captured less than 5% but more than (or reasonably close to) 1% of the popular vote and no electoral votes.
Notable third party presidential performances by state (1832–present)
The list includes the State-wide performance of third party candidates who accrued (or reasonably close to) 5% or more of a States' popular vote.
Many third party candidates also have run under different affiliations in different States, whether it be because of restrictive laws regarding ballot access, cross endorsements by other established parties, etc. In the case of the list below, entries in the party column correspond to the affiliation(s) as presented on the ballot in that State.
| (1832–1860) | ||||||||
|---|---|---|---|---|---|---|---|---|
| Year | State | Party | Nominee | Running mate | # Votes | % Votes | Place | Notes |
| 1832 | Connecticut | Anti-Masonic | William Wirt | Amos Ellmaker | 3,409 | 10.38 / 100 |
3rd | |
| Massachusetts | 14,692 | 21.73 / 100 |
2nd | |||||
| Pennsylvania | 66,689 | 42.04 / 100 |
||||||
| Vermont | 13,106 | 40.79 / 100 |
1st | |||||
| 1844 | Maine | Liberty | James G. Birney | Thomas Morris | 4,836 | 5.69 / 100 |
3rd | |
| Massachusetts | 10,830 | 8.20 / 100 |
||||||
| Michigan | 3,639 | 6.53 / 100 |
||||||
| New Hampshire | 4,161 | 8.46 / 100 |
||||||
| Vermont | 3,970 | 8.13 / 100 |
||||||
| 1848 | Connecticut | Free Soil | Martin Van Buren | Charles Francis Adams Sr. | 5,005 | 8.02 / 100 |
||
| Illinois | 15,702 | 12.60 / 100 |
||||||
| Indiana | 8,100 | 5.30 / 100 |
||||||
| Iowa | 9,863 | 6.36 / 100 |
||||||
| Maine | 1,103 | 4.95 / 100 |
||||||
| Massachusetts | 38,333 | 28.45 / 100 |
2nd | |||||
| Michigan | 10,393 | 15.97 / 100 |
3rd | |||||
| New Hampshire | 7,560 | 15.09 / 100 |
||||||
| New York | 120,497 | 26.43 / 100 |
2nd | |||||
| Ohio | 35,347 | 10.76 / 100 |
3rd | |||||
| Rhode Island | 730 | 6.54 / 100 |
||||||
| Vermont | 13,837 | 28.87 / 100 |
2nd | |||||
| Wisconsin | 10,418 | 26.60 / 100 |
3rd | |||||
| 1852 | Illinois | John P. Hale | George Washington Julian | 9,863 | 6.36 / 100 |
3rd | ||
| Maine | 8,030 | 9.77 / 100 |
||||||
| Massachusetts | 28,023 | 22.05 / 100 |
||||||
| Michigan | 7,237 | 8.73 / 100 |
||||||
| New Hampshire | 6,546 | 12.95 / 100 |
||||||
| Ohio | 31,732 | 8.98 / 100 |
||||||
| Vermont | 8,621 | 19.64 / 100 |
||||||
| Wisconsin | 8,814 | 13.63 / 100 |
||||||
| Georgia | Union | Daniel Webster | Charles J. Jenkins | 5,324 | 8.50 / 100 |
|||
| Alabama | Southern Rights | George Troup | John A. Quitman | 2,205 | 4.99 / 100 |
|||
| 1856 | Alabama | American | Millard Fillmore | Andrew Jackson Donelson | 28,552 | 37.92 / 100 |
2nd | |
| Arkansas | 10,732 | 32.88 / 100 |
||||||
| California | 36,195 | 32.83 / 100 |
||||||
| Delaware | 6,275 | 42.99 / 100 |
||||||
| Florida | 4,833 | 43.19 / 100 |
||||||
| Georgia | 48,669 | 54.00 / 100 |
||||||
| Illinois | 42,439 | 42.86 / 100 |
||||||
| Indiana | 22,386 | 9.51 / 100 |
3rd | |||||
| Iowa | 9,669 | 10.47 / 100 |
||||||
| Kentucky | 67,416 | 47.46 / 100 |
2nd | |||||
| Louisiana | 20,709 | 48.30 / 100 |
||||||
| Maryland | 47,452 | 54.63 / 100 |
1st | |||||
| Massachusetts | 19,626 | 11.54 / 100 |
3rd | |||||
| Mississippi | Whig | 24,191 | 40.56 / 100 |
2nd | ||||
| Missouri | American | 48,522 | 45.57 / 100 |
|||||
| New Jersey | 24,115 | 24.26 / 100 |
3rd | |||||
| New York | 124,206 | 20.89 / 100 |
||||||
| North Carolina | Whig | 36,720 | 43.22 / 100 |
2nd | ||||
| Ohio | American | 28,126 | 7.28 / 100 |
3rd | ||||
| Pennsylvania | 82,189 | 17.86 / 100 |
||||||
| Rhode Island | 1,675 | 8.45 / 100 |
||||||
| Tennessee | 63,878 | 47.82 / 100 |
2nd | |||||
| Texas | 15,639 | 33.41 / 100 |
||||||
| Virginia | 60,150 | 40.04 / 100 |
||||||
| 1860 | Alabama | Constitutional Democratic | John C. Breckinridge | Joseph Lane | 48,669 | 54.00 / 100 |
1st | |
| Arkansas | 28,732 | 53.06 / 100 |
||||||
| California | 33,969 | 28.35 / 100 |
3rd | |||||
| Connecticut | 16,558 | 20.51 / 100 |
||||||
| Delaware | 7,339 | 45.54 / 100 |
1st | |||||
| Florida | 8,277 | 62.23 / 100 |
||||||
| Georgia | 52,176 | 48.89 / 100 |
||||||
| Kentucky | 53,143 | 36.35 / 100 |
2nd | |||||
| Louisiana | 22,681 | 44.90 / 100 |
1st | |||||
| Maine | 6,368 | 6.31 / 100 |
3rd | |||||
| Maryland | 42,482 | 45.93 / 100 |
1st | |||||
| Mississippi | 40,768 | 59.00 / 100 |
||||||
| Missouri | 31,362 | 18.94 / 100 |
3rd | |||||
| North Carolina | 48,486 | 50.51 / 100 |
1st | |||||
| Oregon | 5,074 | 34.37 / 100 |
2nd | |||||
| Pennsylvania | 178,871 | 37.54 / 100 |
||||||
| Tennessee | 65,097 | 44.55 / 100 |
||||||
| Texas | 47,548 | 75.49 / 100 |
1st | |||||
| Virginia | 74,325 | 44.54 / 100 |
2nd | |||||
| Alabama | Constitutional Union | John Bell | Edward Everett | 27,835 | 30.89 / 100 |
2nd | ||
| Arkansas | 20,063 | 37.05 / 100 |
||||||
| California | 9,111 | 7.60 / 100 |
4th | |||||
| Delaware | 3,888 | 24.13 / 100 |
2nd | |||||
| Florida | 4,801 | 36.10 / 100 |
||||||
| Georgia | 42,960 | 40.26 / 100 |
||||||
| Kentucky | 66,058 | 45.18 / 100 |
1st | |||||
| Louisiana | 20,204 | 40.00 / 100 |
2nd | |||||
| Maryland | 41,760 | 45.14 / 100 |
||||||
| Massachusetts | 22,331 | 13.15 / 100 |
3rd | |||||
| Mississippi | 25,045 | 36.25 / 100 |
2nd | |||||
| Missouri | 58,372 | 35.26 / 100 |
||||||
| North Carolina | 45,129 | 46.66 / 100 |
||||||
| Tennessee | 69,728 | 47.72 / 100 |
1st | |||||
| Texas | 15,438 | 24.51 / 100 |
2nd | |||||
| Virginia | 74,481 | 44.63 / 100 |
1st | |||||
| (1864–1900) | ||||||||
|---|---|---|---|---|---|---|---|---|
| Year | State | Party | Nominee | Running mate | # Votes | % Votes | Place | Notes |
| 1876 | Kansas | Greenback | Peter Cooper | Samuel Fenton Cary | 7,770 | 6.26 / 100 |
3rd | |
| 1880 | Iowa | James B. Weaver | Barzillai J. Chambers | 32,327 | 10.02 / 100 |
|||
| Kansas | 19,851 | 9.86 / 100 |
||||||
| Michigan | 34,895 | 9.88 / 100 |
||||||
| Mississippi | 5,797 | 4.95 / 100 |
||||||
| Missouri | 35,042 | 8.82 / 100 |
||||||
| Texas | 27,405 | 11.34 / 100 |
||||||
| West Virginia | 9,008 | 8.00 / 100 |
||||||
| 1884 | Kansas | Benjamin Butler | Absolom M. West | 16,364 | 6.15 / 100 |
|||
| Massachusetts | 24,382 | 8.04 / 100 |
||||||
| 1888 | Minnesota | Prohibition | Clinton B. Fisk | John A. Brooks | 15,311 | 5.82 / 100 |
||
| Arkansas | Union Labor | Alson Streeter | Charles Cunningham | 10,630 | 6.77 / 100 |
|||
| Kansas | 37,788 | 11.41 / 100 |
||||||
| Texas | 29,459 | 8.24 / 100 |
||||||
| 1892 | Alabama | People's | James B. Weaver | James G. Field | 84,984 | 36.55 / 100 |
2nd | |
| Arkansas | 11,831 | 7.99 / 100 |
3rd | |||||
| California | 25,311 | 9.39 / 100 |
||||||
| Colorado | 53,584 | 57.07 / 100 |
1st | |||||
| Florida | 4,843 | 13.65 / 100 |
2nd | |||||
| Georgia | 41,939 | 18.80 / 100 |
3rd | |||||
| Idaho | 10,520 | 54.21 / 100 |
1st | |||||
| Kansas | 163,111 | 50.20 / 100 |
||||||
| Kentucky | 23,500 | 6.89 / 100 |
3rd | |||||
| Minnesota | Fusion | 29,313 | 10.97 / 100 |
|||||
| Mississippi | People's | 10,118 | 19.27 / 100 |
2nd | ||||
| Missouri | 41,204 | 7.61 / 100 |
3rd | |||||
| Montana | 7,338 | 16.50 / 100 |
||||||
| Nebraska | 83,134 | 41.53 / 100 |
2nd | |||||
| Nevada | 7,264 | 66.78 / 100 |
1st | |||||
| North Carolina | 44,336 | 15.82 / 100 |
3rd | |||||
| North Dakota | 17,700 | 49.01 / 100 |
1st | |||||
| Oregon | 26,965 | 34.35 / 100 |
2nd | |||||
| South Dakota | Independent | 26,544 | 37.64 / 100 |
|||||
| Tennessee | People's | 23,918 | 9.00 / 100 |
3rd | ||||
| Texas | 99,688 | 23.61 / 100 |
2nd | |||||
| Washington | 19,165 | 21.79 / 100 |
3rd | |||||
| Wyoming | Democratic | 7,722 | 46.14 / 100 |
2nd | ||||
| Minnesota | Prohibition | John Bidwell | James B. Cranfill | 14,182 | 5.31 / 100 |
4th | ||
| 1900 | Florida | John G. Woolley | Henry B. Metcalf | 2,244 | 5.66 / 100 |
3rd | ||
| Texas | People's | Wharton Barker | Ignatius L. Donnelly | 20,981 | 4.95 / 100 |
|||
| (1904–1940) | ||||||||
|---|---|---|---|---|---|---|---|---|
| Year | State | Party | Nominee | Running mate | # Votes | % Votes | Place | Notes |
| 1904 | California | Socialist | Eugene V. Debs | Ben Hanford | 29,535 | 8.90 / 100 |
3rd | |
| Florida | 2,337 | 5.95 / 100 |
||||||
| Idaho | 4,949 | 6.82 / 100 |
||||||
| Illinois | 69,225 | 6.43 / 100 |
||||||
| Montana | 5,676 | 8.81 / 100 |
||||||
| Nevada | 925 | 7.64 / 100 |
||||||
| Oregon | 7,619 | 8.45 / 100 |
||||||
| Utah | 5,767 | 5.67 / 100 |
||||||
| Washington | 10,023 | 6.91 / 100 |
||||||
| Wisconsin | Social Democratic | 28,240 | 6.37 / 100 |
|||||
| Georgia | People's | Thomas E. Watson | Thomas Tibbles | 22,635 | 17.28 / 100 |
|||
| Nebraska | 20,518 | 9.09 / 100 |
||||||
| 1908 | California | Socialist | Eugene V. Debs | Ben Hanford | 28,659 | 7.41 / 100 |
||
| Florida | 3,747 | 7.59 / 100 |
||||||
| Idaho | 6,400 | 6.58 / 100 |
||||||
| Montana | 5,855 | 8.51 / 100 |
||||||
| Nevada | 2,103 | 8.57 / 100 |
||||||
| Oklahoma | 21,734 | 8.52 / 100 |
||||||
| Oregon | 7,339 | 6.62 / 100 |
||||||
| Washington | 14,177 | 7.71 / 100 |
||||||
| Wisconsin | Social Democratic | 28,147 | 6.19 / 100 |
|||||
| Georgia | People's | Thomas E. Watson | Samuel Williams | 16,687 | 12.59 / 100 |
|||
| 1912 | Alabama | Progressive | Theodore Roosevelt | Hiram Johnson | 22,680 | 19.24 / 100 |
2nd | |
| Arizona | 6,949 | 29.29 / 100 |
||||||
| Arkansas | 21,644 | 17.30 / 100 |
3rd | |||||
| California | Republican | 283,610 | 41.83 / 100 |
1st | ||||
| Colorado | Progressive | 72,306 | 27.09 / 100 |
2nd | ||||
| Connecticut | 34,129 | 17.92 / 100 |
3rd | |||||
| Delaware | 8,886 | 18.25 / 100 |
||||||
| Florida | 4,555 | 8.96 / 100 |
||||||
| Georgia | 21,985 | 18.10 / 100 |
2nd | |||||
| Idaho | 25,527 | 24.14 / 100 |
3rd | |||||
| Illinois | 386,478 | 33.72 / 100 |
2nd | |||||
| Indiana | 162,007 | 24.75 / 100 |
||||||
| Iowa | 161,819 | 32.87 / 100 |
||||||
| Kentucky | 101,766 | 22.48 / 100 |
3rd | |||||
| Kansas | Independent | 120,210 | 32.88 / 100 |
2nd | ||||
| Louisiana | Progressive | 9,283 | 11.71 / 100 |
|||||
| Maine | 48,495 | 37.41 / 100 |
||||||
| Maryland | 57,789 | 24.91 / 100 |
||||||
| Massachusetts | 142,228 | 29.14 / 100 |
3rd | |||||
| Michigan | 214,584 | 38.95 / 100 |
1st | |||||
| Minnesota | 125,856 | 37.66 / 100 |
||||||
| Mississippi | 3,459 | 5.50 / 100 |
2nd | |||||
| Missouri | 124,375 | 17.80 / 100 |
3rd | |||||
| Montana | 22,456 | 28.13 / 100 |
2nd | |||||
| Nebraska | 72,681 | 29.13 / 100 |
||||||
| Nevada | 5,620 | 27.94 / 100 |
||||||
| New Hampshire | 17,794 | 20.23 / 100 |
3rd | |||||
| New Jersey | 145,410 | 33.60 / 100 |
2nd | |||||
| New Mexico | 8,347 | 16.90 / 100 |
3rd | |||||
| New York | 390,093 | 24.56 / 100 |
||||||
| North Carolina | 69,130 | 28.34 / 100 |
2nd | |||||
| North Dakota | 25,726 | 29.71 / 100 |
||||||
| Ohio | 229,807 | 22.16 / 100 |
3rd | |||||
| Oregon | 37,600 | 27.44 / 100 |
2nd | |||||
| Pennsylvania | 444,894 | 36.53 / 100 |
1st | |||||
| Rhode Island | 16,878 | 21.67 / 100 |
3rd | |||||
| South Dakota | Republican | 58,811 | 50.56 / 100 |
1st | ||||
| Tennessee | Progressive | 54,041 | 21.45 / 100 |
3rd | ||||
| Texas | 26,745 | 8.86 / 100 |
||||||
| Utah | 24,174 | 21.51 / 100 |
||||||
| Vermont | 22,132 | 35.22 / 100 |
2nd | |||||
| Virginia | 21,777 | 15.90 / 100 |
3rd | |||||
| Washington | 113,698 | 35.22 / 100 |
1st | |||||
| West Virginia | 79,112 | 29.43 / 100 |
2nd | |||||
| Wisconsin | 62,448 | 15.61 / 100 |
3rd | |||||
| Wyoming | 9,232 | 21.83 / 100 |
||||||
| Arizona | Socialist | Eugene V. Debs | Emil Seidel | 3,163 | 13.33 / 100 |
|||
| Arkansas | 8,153 | 6.52 / 100 |
4th | |||||
| California | 79,201 | 11.68 / 100 |
3rd | |||||
| Colorado | 16,418 | 6.15 / 100 |
4th | |||||
| Connecticut | 10,056 | 5.28 / 100 |
||||||
| Florida | 4,806 | 9.45 / 100 |
2nd | |||||
| Idaho | 11,960 | 11.31 / 100 |
4th | |||||
| Illinois | 81,278 | 7.09 / 100 |
||||||
| Indiana | 36,931 | 5.64 / 100 |
||||||
| Kansas | 26,779 | 7.33 / 100 |
||||||
| Louisiana | 5,261 | 6.64 / 100 |
3rd | |||||
| Minnesota | Public Ownership | 27,505 | 8.23 / 100 |
4th | ||||
| Montana | Socialist | 10,885 | 13.64 / 100 |
|||||
| Nevada | 3,313 | 16.47 / 100 |
3rd | |||||
| New Mexico | 2,859 | 5.79 / 100 |
4th | |||||
| North Dakota | 6,966 | 8.05 / 100 |
||||||
| Ohio | 90,144 | 8.69 / 100 |
||||||
| Oklahoma | 41,674 | 16.42 / 100 |
3rd | |||||
| Oregon | 13,343 | 9.74 / 100 |
4th | |||||
| Pennsylvania | 83,614 | 6.87 / 100 |
||||||
| Texas | 24,896 | 8.25 / 100 |
||||||
| Utah | 9,023 | 8.03 / 100 |
||||||
| Washington | 40,134 | 12.43 / 100 |
||||||
| West Virginia | 15,248 | 5.67 / 100 |
||||||
| Wisconsin | Social Democratic | 33,476 | 8.37 / 100 |
|||||
| Wyoming | Socialist | 2,760 | 6.53 / 100 |
|||||
| 1916 | Arizona | Socialist | Allan L. Benson | George Ross Kirkpatrick | 3,174 | 5.47 / 100 |
3rd | |
| Florida | 5,353 | 6.63 / 100 |
||||||
| Idaho | 8,066 | 5.99 / 100 |
||||||
| Minnesota | 20,117 | 5.19 / 100 |
||||||
| Montana | 9,564 | 5.38 / 100 |
||||||
| Nevada | 3,065 | 9.20 / 100 |
||||||
| North Dakota | 5,716 | 4.95 / 100 |
||||||
| Oklahoma | 45,190 | 15.45 / 100 |
||||||
| Texas | 18,963 | 5.09 / 100 |
||||||
| Washington | 22,800 | 5.98 / 100 |
||||||
| Wisconsin | 27,631 | 6.18 / 100 |
||||||
| Florida | Prohibition | Frank Hanly | Ira Landrith | 4,786 | 5.93 / 100 |
4th | ||
| Georgia | Progressive | Unpledged | John M. Parker | 20,692 | 12.88 / 100 |
2nd | ||
| Louisiana | 6,349 | 6.83 / 100 |
3rd | |||||
| 1920 | California | Socialist | Eugene V. Debs | Seymour Stedman | 64,076 | 6.79 / 100 |
||
| Minnesota | 56,106 | 7.62 / 100 |
||||||
| Nevada | 1,864 | 6.85 / 100 |
||||||
| New York | 203,201 | 7.01 / 100 |
||||||
| Oklahoma | 25,726 | 5.09 / 100 |
||||||
| Wisconsin | 80,635 | 11.50 / 100 |
||||||
| Montana | Farmer–Labor | Parley P. Christensen | Max S. Hayes | 12,204 | 6.82 / 100 |
|||
| South Dakota | Nonpartisan League | 34,707 | 19.04 / 100 |
|||||
| Washington | Farmer–Labor | 77,246 | 19.37 / 100 |
|||||
| Texas | American | James E. Ferguson | William Hough | 47,968 | 9.86 / 100 |
3rd | ||
| Black & Tan Republican | Unpledged electors | 27,247 | 5.60 / 100 |
4th | ||||
| 1924 | Alabama | Progressive | Robert M. La Follette Sr. | Burton K. Wheeler | 8,040 | 4.95 / 100 |
3rd | |
| Arizona | 17,210 | 23.27 / 100 |
||||||
| Arkansas | 13,173 | 9.51 / 100 |
||||||
| California | Socialist | 424,649 | 33.13 / 100 |
2nd | ||||
| Colorado | Progressive | 69,945 | 20.44 / 100 |
3rd | ||||
| Connecticut | 42,416 | 10.60 / 100 |
||||||
| Delaware | 4,979 | 5.48 / 100 |
||||||
| Florida | 8,625 | 7.90 / 100 |
||||||
| Georgia | 12,691 | 7.62 / 100 |
||||||
| Idaho | 54,160 | 36.52 / 100 |
2nd | |||||
| Illinois | 432,027 | 17.49 / 100 |
3rd | |||||
| Indiana | 71,700 | 5.64 / 100 |
||||||
| Iowa | 274,448 | 28.10 / 100 |
2nd | |||||
| Kansas | Independent | 98,461 | 14.86 / 100 |
3rd | ||||
| Maine | Progressive | 11,382 | 5.92 / 100 |
|||||
| Maryland | 47,157 | 13.15 / 100 |
||||||
| Massachusetts | 141,225 | 12.50 / 100 |
||||||
| Michigan | 122,014 | 10.51 / 100 |
||||||
| Minnesota | Independent | 339,192 | 41.26 / 100 |
2nd | ||||
| Missouri | Socialist | 84,160 | 6.43 / 100 |
3rd | ||||
| Montana | Progressive | 66,123 | 37.91 / 100 |
2nd | ||||
| Nebraska | 106,701 | 22.99 / 100 |
3rd | |||||
| Nevada | Independent | 9,769 | 36.29 / 100 |
2nd | ||||
| New Hampshire | Progressive | 8,993 | 5.46 / 100 |
3rd | ||||
| New Jersey | 108,901 | 10.03 / 100 |
||||||
| New Mexico | 9,543 | 8.46 / 100 |
||||||
| New York | Socialist | 268,510 | 8.23 / 100 |
|||||
| Progressive | 206,395 | 6.32 / 100 |
||||||
| Total | 474,905 | 14.55 / 100 |
||||||
| North Dakota | Nonpartisan League | 89,922 | 45.17 / 100 |
2nd | ||||
| Ohio | Progressive | 357,948 | 17.75 / 100 |
3rd | ||||
| Oklahoma | Farmer–Labor | 46,375 | 8.78 / 100 |
|||||
| Oregon | Independent | 68,403 | 24.47 / 100 |
2nd | ||||
| Pennsylvania | Farmer–Labor | 214,126 | 9.98 / 100 |
3rd | ||||
| Socialist | 93,441 | 4.36 / 100 |
||||||
| Total | 307,567 | 14.34 / 100 |
||||||
| South Dakota | Independent | 75,355 | 36.96 / 100 |
2nd | ||||
| Texas | Progressive | 42,881 | 6.52 / 100 |
3rd | ||||
| Utah | 32,662 | 20.81 / 100 |
2nd | |||||
| Vermont | 5,964 | 5.79 / 100 |
3rd | |||||
| Washington | 150,727 | 35.76 / 100 |
2nd | |||||
| West Virginia | Farmer–Labor | 36,723 | 6.29 / 100 |
3rd | ||||
| Wisconsin | Independent | 453,678 | 53.96 / 100 |
1st | [19] | |||
| Wyoming | Progressive | 25,174 | 31.51 / 100 |
2nd | ||||
| Florida | Prohibition | Herman P. Faris | Marie C. Brehm | 5,498 | 5.04 / 100 |
4th | ||
| 1936 | Massachusetts | Union | William Lemke | Thomas C. O'Brien | 118,639 | 6.45 / 100 |
3rd | |
| Minnesota | 74,296 | 6.58 / 100 |
||||||
| North Dakota | 36,708 | 13.41 / 100 |
||||||
| Oregon | 21,831 | 5.27 / 100 |
||||||
| Rhode Island | 19,569 | 6.29 / 100 |
||||||
| (1944–1980) | ||||||||
|---|---|---|---|---|---|---|---|---|
| Year | State | Party | Nominee | Running mate | # Votes | % Votes | Place | Notes |
| 1944 | South Carolina | Southern Democratic | Unpledged electors | 7,799 | 7.54 / 100 |
2nd | ||
| Texas | Texas Regulars | 135,439 | 11.77 / 100 |
3rd | ||||
| 1948 | Alabama | Democratic | Strom Thurmond | Fielding L. Wright | 171,443 | 79.75 / 100 |
1st | [20] |
| Arkansas | States' Rights Democratic | 40,068 | 16.52 / 100 |
3rd | ||||
| Florida | 89,755 | 15.54 / 100 |
||||||
| Georgia | 85,055 | 20.31 / 100 |
2nd | |||||
| Louisiana | 204,290 | 49.07 / 100 |
1st | [20] | ||||
| Mississippi | Democratic | 167,538 | 87.17 / 100 |
[20] | ||||
| North Carolina | States' Rights Democratic | 69,652 | 8.80 / 100 |
3rd | ||||
| South Carolina | 102,607 | 71.97 / 100 |
1st | [20] | ||||
| Tennessee | 73,815 | 13.41 / 100 |
3rd | |||||
| Texas | 113,776 | 9.11 / 100 |
||||||
| Virginia | 43,393 | 10.35 / 100 |
||||||
| New York | American Labor | Henry A. Wallace | Glen Taylor | 509,559 | 8.25 / 100 |
|||
| 1956 | Louisiana | States' Rights Democratic | Unpledged electors | 44,520 | 7.21 / 100 |
[21] | ||
| Mississippi | 42,966 | 17.31 / 100 |
||||||
| South Carolina | 88,511 | 29.45 / 100 |
2nd | |||||
| Virginia | T. Coleman Andrews | Thomas H. Werdel | 42,964 | 6.16 / 100 |
3rd | |||
| 1960 | Alabama | Unpledged electors[22] | 324,050 | 36.47 / 100 |
1st | [21][23] | ||
| Louisiana | Independent | 169,572 | 20.99 / 100 |
3rd | ||||
| Mississippi | 116,248 | 38.99 / 100 |
1st | [23] | ||||
| 1964 | Alabama | Democratic | 210,732 | 30.55 / 100 |
2nd | [21] | ||
| 1968 | Alabama | George Wallace | Curtis LeMay (Official VP Nominee) |
691,425 | 65.86 / 100 |
1st | [24] | |
| Alaska | Independent | 10,024 | 12.07 / 100 |
3rd | ||||
| Arizona | American Independent | 46,573 | 9.56 / 100 |
|||||
| Arkansas | 235,627 | 38.65 / 100 |
1st | [24] | ||||
| California | 487,270 | 6.72 / 100 |
3rd | |||||
| Colorado | Marvin Griffin (Provisional VP Nominee) |
60,813 | 7.50 / 100 |
|||||
| Connecticut | Curtis LeMay (Official VP Nominee) |
76,650 | 6.10 / 100 |
|||||
| Delaware | 28,459 | 13.28 / 100 |
||||||
| Florida | 676,794 | 28.53 / 100 |
||||||
| Georgia | Marvin Griffin (Provisional VP Nominee) |
535,550 | 42.83 / 100 |
1st | [24] | |||
| Idaho | Curtis LeMay (Official VP Nominee) |
36,541 | 12.55 / 100 |
3rd | ||||
| Illinois | Independent | 390,958 | 8.46 / 100 |
|||||
| Indiana | American Independent | Marvin Griffin (Provisional VP Nominee) |
243,108 | 11.45 / 100 |
||||
| Iowa | 66,422 | 5.69 / 100 |
||||||
| Kansas | Conservative | 88,291 | 10.19 / 100 |
|||||
| Kentucky | American Independent | 193,098 | 18.29 / 100 |
|||||
| Louisiana | Curtis LeMay (Official VP Nominee) |
530,300 | 48.32 / 100 |
1st | [24] | |||
| Maryland | Marvin Griffin (Provisional VP Nominee) |
178,734 | 14.47 / 100 |
3rd | ||||
| Michigan | 331,968 | 10.04 / 100 |
||||||
| Mississippi | Independent | Curtis LeMay (Official VP Nominee) |
415,349 | 63.46 / 100 |
1st | [24] | ||
| Missouri | American Independent | Marvin Griffin (Provisional VP Nominee) |
206,126 | 11.39 / 100 |
3rd | |||
| Montana | 20,015 | 7.29 / 100 |
||||||
| Nebraska | 44,094 | 8.36 / 100 |
||||||
| Nevada | 20,432 | 13.25 / 100 |
||||||
| New Jersey | 262,187 | 9.12 / 100 |
||||||
| New Mexico | 25,737 | 7.86 / 100 |
||||||
| New York | Courage | 358,864 | 5.29 / 100 |
|||||
| North Carolina | American Independent | Curtis LeMay (Official VP Nominee) |
496,188 | 31.26 / 100 |
2nd | |||
| North Dakota | Independent | 14,244 | 5.75 / 100 |
3rd | ||||
| Ohio | American Independent | Marvin Griffin (Provisional VP Nominee) |
467,495 | 11.81 / 100 |
||||
| Oklahoma | Curtis LeMay (Official VP Nominee) |
191,731 | 20.33 / 100 |
|||||
| Oregon | Independent | 49,683 | 6.06 / 100 |
|||||
| Pennsylvania | American Independent | Marvin Griffin (Provisional VP Nominee) |
378,582 | 7.97 / 100 |
||||
| South Carolina | Independent | Curtis LeMay (Official VP Nominee) |
215,430 | 32.30 / 100 |
2nd | |||
| Tennessee | American Independent | 424,792 | 34.02 / 100 |
|||||
| Texas | 584,269 | 18.97 / 100 |
3rd | |||||
| Utah | 26,906 | 6.37 / 100 |
||||||
| Virginia | 321,833 | 23.64 / 100 |
||||||
| Washington | Marvin Griffin (Provisional VP Nominee) |
96,990 | 7.74 / 100 |
|||||
| West Virginia | 72,560 | 9.62 / 100 |
||||||
| Wisconsin | Independent | 127,835 | 7.56 / 100 |
|||||
| Wyoming | 11,105 | 8.73 / 100 |
||||||
| 1972 | Alaska | American Independent | John G. Schmitz | Thomas J. Anderson | 6,903 | 7.25 / 100 |
||
| Idaho | 28,869 | 9.30 / 100 |
||||||
| Louisiana | 52,099 | 4.95 / 100 |
||||||
| Oregon | Independent | 46,211 | 4.98 / 100 |
|||||
| Utah | American Independent | 28,549 | 5.97 / 100 |
|||||
| 1976 | Alaska | Libertarian | Roger MacBride | David Bergland | 6,785 | 7.25 / 100 |
||
| 1980 | Alaska | Ed Clark | David Koch | 18,479 | 11.87 / 100 |
[25] | ||
| Independent | John B. Anderson | Patrick Lucey (Official VP Nominee) |
11,155 | 7.04 / 100 |
4th | [26] | ||
| Arizona | 76,952 | 8.81 / 100 |
3rd | |||||
| California | 739,833 | 8.62 / 100 |
||||||
| Colorado | 130,633 | 11.03 / 100 |
||||||
| Connecticut | Anderson Coalition (Later National Unity) |
171,807 | 12.22 / 100 |
|||||
| Delaware | 171,807 | 6.91 / 100 |
||||||
| District of Columbia | Independent | 16,131 | 9.28 / 100 |
|||||
| Florida | 189,692 | 5.14 / 100 |
||||||
| Hawaii | 32,021 | 10.56 / 100 |
||||||
| Idaho | 27,058 | 6.19 / 100 |
||||||
| Illinois | 346,754 | 7.30 / 100 |
||||||
| Iowa | 115,633 | 8.78 / 100 |
||||||
| Kansas | 68,231 | 6.96 / 100 |
||||||
| Maine | 53,327 | 10.20 / 100 |
||||||
| Maryland | 119,537 | 7.76 / 100 |
||||||
| Massachusetts | Anderson Coalition (Later National Unity) |
382,539 | 15.15 / 100 |
|||||
| Michigan | 275,223 | 7.04 / 100 |
||||||
| Minnesota | 174,990 | 8.53 / 100 |
||||||
| Montana | Independent | 29,281 | 8.05 / 100 |
|||||
| Nebraska | 44,993 | 7.02 / 100 |
||||||
| Nevada | 17,651 | 7.12 / 100 |
||||||
| New Hampshire | 49,693 | 12.94 / 100 |
||||||
| New Jersey | Anderson Coalition (Later National Unity) |
234,632 | 7.88 / 100 |
|||||
| New Mexico | Independent | 29,459 | 6.46 / 100 |
|||||
| New York | Liberal | 467,801 | 7.54 / 100 |
|||||
| North Dakota | Independent | 23,640 | 7.84 / 100 |
|||||
| Ohio | 254,472 | 5.94 / 100 |
||||||
| Oregon | 112,389 | 9.51 / 100 |
||||||
| Pennsylvania | Anderson Coalition (Later National Unity) |
292,921 | 6.42 / 100 |
|||||
| Rhode Island | 59,819 | 14.38 / 100 |
||||||
| South Dakota | Independent | Flint (Provisional VP Nominee) |
21,431 | 6.54 / 100 |
||||
| Utah | Patrick Lucey (Official VP Nominee) |
30,284 | 5.01 / 100 |
|||||
| Vermont | 31,760 | 14.90 / 100 |
||||||
| Virginia | 95,418 | 5.11 / 100 |
||||||
| Washington | 185,073 | 10.62 / 100 |
||||||
| Wisconsin | 160,657 | 7.07 / 100 |
||||||
| Wyoming | 12,072 | 6.83 / 100 |
||||||
| (1984–Present) | ||||||||
|---|---|---|---|---|---|---|---|---|
| Year | State | Party | Nominee | Running mate | # Votes | % Votes | Place | Notes |
| 1992 | Alabama | Independent | Ross Perot | James Stockdale | 183,109 | 10.85 / 100 |
3rd | [27] |
| Alaska | 73,481 | 28.43 / 100 |
||||||
| Arizona | 353,741 | 23.79 / 100 |
||||||
| Arkansas | 99,132 | 10.43 / 100 |
||||||
| California | 2,296,006 | 20.63 / 100 |
||||||
| Colorado | 366,010 | 23.32 / 100 |
||||||
| Connecticut | American for Perot (Later Reform Party) |
348,771 | 21.58 / 100 |
|||||
| Delaware | Independent | 59,213 | 20.45 / 100 |
|||||
| Florida | 1,053,067 | 19.82 / 100 |
||||||
| Georgia | 353,741 | 23.79 / 100 |
||||||
| Hawaii | 53,003 | 14.22 / 100 |
||||||
| Idaho | 130,395 | 27.05 / 100 |
||||||
| Illinois | 840,515 | 16.64 / 100 |
||||||
| Indiana | 455,934 | 19.77 / 100 |
||||||
| Iowa | 253,468 | 18.71 / 100 |
||||||
| Kansas | 312,358 | 26.99 / 100 |
||||||
| Kentucky | 203,944 | 13.66 / 100 |
||||||
| Louisiana | Prudence, Action, Results (Later Reform Party) |
211,478 | 11.81 / 100 |
|||||
| Maine | Independent | 206,820 | 30.44 / 100 |
2nd | [28] | |||
| Maryland | 281,414 | 14.18 / 100 |
3rd | |||||
| Massachusetts | 632,312 | 22.80 / 100 |
||||||
| Michigan | 824,813 | 19.30 / 100 |
||||||
| Minnesota | 562,506 | 23.96 / 100 |
||||||
| Mississippi | 85,626 | 8.72 / 100 |
[29] | |||||
| Missouri | 518,741 | 21.69 / 100 |
||||||
| Montana | 107,225 | 26.12 / 100 |
||||||
| Nebraska | 174,687 | 23.63 / 100 |
||||||
| Nevada | 132,580 | 26.19 / 100 |
||||||
| New Hampshire | 121,337 | 22.59 / 100 |
||||||
| New Jersey | 521,829 | 15.61 / 100 |
||||||
| New Mexico | 91,895 | 16.12 / 100 |
||||||
| New York | 1,090,721 | 15.75 / 100 |
||||||
| North Carolina | 357,864 | 13.70 / 100 |
||||||
| North Dakota | 71,084 | 23.07 / 100 |
||||||
| Ohio | 1,036,426 | 20.98 / 100 |
||||||
| Oklahoma | 319,878 | 23.01 / 100 |
||||||
| Oregon | 354,091 | 24.21 / 100 |
||||||
| Pennsylvania | Pennsylvanians (Later Reform Party) |
902,667 | 18.20 / 100 |
|||||
| Rhode Island | Perot for President (Later Reform Party) |
105,045 | 23.16 / 100 |
|||||
| South Carolina | Independent | 138,872 | 11.55 / 100 |
|||||
| South Dakota | 73,295 | 21.80 / 100 |
||||||
| Tennessee | 199,968 | 10.09 / 100 |
||||||
| Texas | 1,354,781 | 22.01 / 100 |
||||||
| Utah | 203,400 | 27.34 / 100 |
2nd | [30] | ||||
| Vermont | 65,991 | 22.78 / 100 |
3rd | |||||
| Virginia | 348,639 | 13.63 / 100 |
||||||
| Washington | 541,780 | 23.68 / 100 |
||||||
| West Virginia | 108,829 | 15.91 / 100 |
||||||
| Wisconsin | 544,479 | 21.51 / 100 |
||||||
| Wyoming | 51,263 | 25.65 / 100 |
||||||
| 1996 | Alabama | Independent | Ross Perot | Pat Choate (Official VP Nominee) |
92,149 | 6.01 / 100 |
[27] | |
| Alaska | Reform | 26,333 | 10.90 / 100 |
|||||
| Arizona | 112,072 | 7.98 / 100 |
||||||
| Arkansas | 69,884 | 7.90 / 100 |
||||||
| California | James Campbell (Provisional VP Nominee) |
697,849 | 6.96 / 100 |
|||||
| Colorado | Pat Choate (Official VP Nominee) |
99,629 | 6.59 / 100 |
|||||
| Connecticut | 139,523 | 10.02 / 100 |
||||||
| Delaware | Independent | 28,719 | 10.60 / 100 |
|||||
| Florida | Reform | 483,870 | 9.12 / 100 |
|||||
| Georgia | 146,337 | 6.37 / 100 |
||||||
| Hawaii | 27,358 | 7.60 / 100 |
||||||
| Idaho | 62,518 | 12.71 / 100 |
||||||
| Illinois | 346,408 | 8.03 / 100 |
||||||
| Indiana | James Campbell (Provisional VP Nominee) |
224,299 | 10.50 / 100 |
|||||
| Iowa | 105,159 | 8.52 / 100 |
||||||
| Kansas | 92,639 | 8.62 / 100 |
||||||
| Kentucky | Pat Choate (Official VP Nominee) |
120,396 | 8.67 / 100 |
|||||
| Louisiana | James Campbell (Provisional VP Nominee) |
123,293 | 6.91 / 100 |
|||||
| Maine | 85,970 | 14.19 / 100 |
[31] | |||||
| Maryland | 115,812 | 6.50 / 100 |
||||||
| Massachusetts | Pat Choate (Official VP Nominee) |
227,217 | 8.89 / 100 |
|||||
| Michigan | 336,870 | 8.75 / 100 |
||||||
| Minnesota | 257,704 | 11.75 / 100 |
||||||
| Mississippi | Independent | 52,222 | 5.84 / 100 |
|||||
| Missouri | Reform | James Campbell (Provisional VP Nominee) |
217,188 | 10.06 / 100 |
||||
| Montana | 55,229 | 13.56 / 100 |
||||||
| Nebraska | Pat Choate (Official VP Nominee) |
71,278 | 10.52 / 100 |
|||||
| Nevada | 43,986 | 9.47 / 100 |
||||||
| New Hampshire | 48,390 | 9.69 / 100 |
||||||
| New Jersey | Independent | 262,134 | 8.52 / 100 |
|||||
| New Mexico | Reform | 32,257 | 5.80 / 100 |
|||||
| New York | Independence | 503,458 | 7.97 / 100 |
|||||
| North Carolina | Reform | 168,059 | 6.68 / 100 |
|||||
| North Dakota | Hanson (Provisional VP Nominee) |
32,515 | 12.20 / 100 |
|||||
| Ohio | James Campbell (Provisional VP Nominee) |
483,207 | 10.66 / 100 |
|||||
| Oklahoma | Pat Choate (Official VP Nominee) |
130,788 | 10.84 / 100 |
|||||
| Oregon | James Campbell (Provisional VP Nominee) |
121,221 | 8.80 / 100 |
|||||
| Pennsylvania | Pat Choate (Official VP Nominee) |
430,984 | 9.56 / 100 |
|||||
| Rhode Island | 43,723 | 11.20 / 100 |
||||||
| South Carolina | 64,386 | 5.60 / 100 |
||||||
| South Dakota | Independent | James Campbell (Provisional VP Nominee) |
31,250 | 9.65 / 100 |
||||
| Tennessee | 105,918 | 5.59 / 100 |
[32] | |||||
| Texas | 378,537 | 6.75 / 100 |
||||||
| Utah | Reform | Pat Choate (Official VP Nominee) |
66,461 | 9.98 / 100 |
||||
| Vermont | 31,024 | 12.00 / 100 |
||||||
| Virginia | 159,861 | 6.62 / 100 |
||||||
| Washington | 201,003 | 8.92 / 100 |
||||||
| West Virginia | 71,639 | 11.26 / 100 |
||||||
| Wisconsin | 227,339 | 10.35 / 100 |
||||||
| Wyoming | Independent | 25,928 | 12.25 / 100 |
|||||
| 2000 | Alaska | Green | Ralph Nader | Winona LaDuke | 28,747 | 10.07 / 100 |
[33] | |
| Colorado | 91,434 | 5.25 / 100 |
||||||
| Washington, D.C. | 10,576 | 5.24 / 100 |
||||||
| Hawaii | 21,623 | 5.88 / 100 |
||||||
| Maine | 37,127 | 5.70 / 100 |
||||||
| Massachusetts | 173,564 | 6.42 / 100 |
||||||
| Minnesota | 126,696 | 5.20 / 100 |
||||||
| Montana | 24,437 | 5.95 / 100 |
||||||
| Oregon | 77,357 | 5.04 / 100 |
||||||
| Rhode Island | 25,052 | 6.12 / 100 |
||||||
| Vermont | 20,374 | 6.92 / 100 |
||||||
| 2016 | Alaska | Libertarian | Gary Johnson | William Weld | 18,782 | 5.90 / 100 |
3rd | |
| Colorado | 144,121 | 5.18 / 100 |
||||||
| Maine | 37,578 | 5.10 / 100 |
||||||
| Montana | 28,036 | 5.67 / 100 |
||||||
| New Mexico | 74,541 | 9.34 / 100 |
||||||
| North Dakota | 21,434 | 6.22 / 100 |
||||||
| Oklahoma | 83,481 | 5.75 / 100 |
||||||
| South Dakota | 20,845 | 5.63 / 100 |
||||||
| Wyoming | 13,287 | 5.19 / 100 |
||||||
| Idaho | Independent | Evan McMullin | Nathan Johnson (Provisional VP Nominee) |
46,476 | 6.73 / 100 |
|||
| Utah | 243,685 | 21.54 / 100 |
||||||
| Vermont | Write-in | Bernie Sanders | None | 18,183 | 5.67 / 100 |
[34] | ||
Notable third party cross-endorsement presidential performances by state (1896–present)
The list includes the State-wide performance of major party candidates on party ballot lines other than their own, either through electoral fusion or having to run in opposition to their state party. This does not include those cases, such as found in present-day Connecticut or California, where a third party shares the same ballot line as the main party. The vote totals and percentages listed are those they received under that particular party label.
Once widespread, fusion as conventionally practiced remains legal in only eight states, and is most recognized by its use in New York.
Selected third party performances
1856 presidential election
In 1856 the two-party system of Democrats and Whigs collapsed. The Whigs, who had been one-half of the two-party system since 1832 and had won the presidency in 1840 and 1848, disintegrated. Southern Whigs and a minority of northern Whigs coalesced around the anti-immigrant and anti-Catholic American Party, better known as the "Know Nothing" movement. Their candidate was former President Millard Fillmore, who won 22% but carried only one state, Maryland, thus winning 8 electoral votes. Many Northern Whigs, such as Abraham Lincoln, joined the newly formed Republican Party. The Republicans ran John C. Frémont, who finished second with 33.1% and 114 electoral votes. Democrat James Buchanan won the election.
1860 presidential election
John C. Breckinridge, the third party candidate of southern Democrats, got 18.2% of the popular vote and won 72 electoral votes from several south states. John Bell of the Constitutional Union Party finished with 12.6% of the popular vote, but only won 39 electoral votes from three states. Though both Bell and Breckinridge were unable to capture as many popular votes as the two main presidential candidates (Republican Abraham Lincoln and Democrat Stephen A. Douglas), this election would mark the first time any third party received more electoral votes than one of the major candidates in a US presidential election. Douglas finished with 29.5% of the popular vote, but only won 12 electoral votes from two states.
In 1864 Abraham Lincoln ran his re-election campaign as a third party, known as National Union party, consisting of both Democrats, and Republicans.
1872 presidential election
In the 1872 election, newspaper publisher and former Congressman Horace Greeley was nominated by the Liberal Republicans to oppose incumbent Republican President Ulysses S. Grant. The Liberal Republicans were a breakaway faction of the Republican Party that was dissatisfied with Grant's presidency. Determined to defeat Grant, the Democratic Party also nominated Greeley, making Greeley both a third party nominee and a major party nominee. Greeley won six states and 43.8% of the popular vote, but died shortly after election day, so most of the electoral votes that were pledged to Greeley instead went to Democrat Thomas Hendricks or Greeley's running mate, Liberal Republican Benjamin Gratz Brown.
1892 presidential election
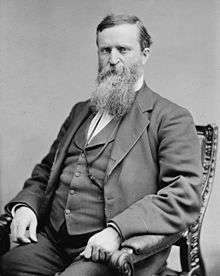
James B. Weaver, the Greenback Labor nominee in 1880, ran as presidential candidate for the Populist Party. The Populist Party won 22 electoral votes and 8.51 percent of the popular vote . The Democratic Party eventually adopted many Populist Party positions after this election, notably the Populist call for the free coinage of silver, making this contest a prominent example of a delayed vote for change.
1912 presidential election
Republican Theodore Roosevelt ran as the "Bull Moose Party" (Progressive Party) nominee in the 1912 election. Roosevelt won 27.4% of the popular vote and carried six states totaling 88 electoral votes. Overall, Roosevelt's effort was the most successful third-party candidacy in American history. It was also the only third-party effort to finish higher than third in the popular votes and only the second to do so in electoral votes. Instead incumbent Republican President William Howard Taft finished third, taking only 23% of the popular vote and 8 electoral votes. The split in the Republican vote gave Democrat Woodrow Wilson victory with 42% of the popular vote, but 435 electoral votes.
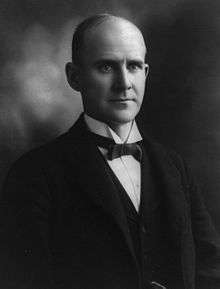
Eugene V. Debs, running in his fourth consecutive Presidential election as the Socialist Party candidate, won 6% of the vote, an all-time high for the Socialists. The elections of 1824, 1860 and 1912 are the only three times that four candidates each cleared 5% of the popular vote in a Presidential election.
1924 presidential election
Erstwhile Republican Robert M. La Follette ran as a Progressive. After the Democrats nominated conservative John W. Davis, many liberal Democrats turned to La Follette. He received 4,831,706 votes for 16.6% of the popular vote and won his home state of Wisconsin receiving 13 electoral votes. With the Democrats split, incumbent President Calvin Coolidge won election by a wide margin.
1948 presidential election
Democrat Strom Thurmond ran on the segregationist States' Rights ("Dixiecrat") ticket. Former Vice President Henry A. Wallace ran on the liberal left as the candidate of a new Progressive Party. Thus the Democratic vote was split three ways, between Thurmond on the right, Wallace on the left, and incumbent President Harry S. Truman in the center. Thurmond received 1,175,930 votes (2.4%) and 39 votes in the electoral college from Southern states. Wallace earned 1,157,328 votes for an identical 2.4% of the popular vote, but no votes in the Electoral College due to his support being mostly concentrated in the more populous states of New York and California.
The Unpledged Electors Movement 1944-1964
With the Democratic party becoming more amenable to the Civil Rights movement, the numerous southern Democrats split from the party and started putting up slates of unpledged electors to compete with the national Democratic ticket. During the 1952, 1956 and 1960 elections these received a substantial percentage of votes, most notably coming in second in South Carolina in 1956 ahead of President Eisenhower, and actually winning Mississippi and splitting the electoral vote in Alabama in 1960, giving segregationist Senator Harry F. Byrd of Virginia 14 electoral votes. In 1964 Alabama members of the movement refused to put President Johnson on the ballot, leaving the electors unpledged.
1968 presidential election
Former Democratic Governor of Alabama George Wallace ran on the American Independent Party line. Wallace received 9,901,118 votes for 13.5% of the popular vote, receiving 45 electoral votes in the South and many votes in the North. Wallace remains the only third party candidate since 1948 to win a state.
1972 presidential election
Despite only garnering 3,674 votes (roughly 0.00005% of the actual electorate), John G. Hospers of the Libertarian Party secured one electoral vote in this election due to Virginia faithless elector, Roger MacBride.[35] This made it the last time that a third-party managed to gain any electoral votes. In addition, the results of the faithless elector made the Libertarian vice-presidential nominee Theodora "Tonie" Nathan became the first woman in U.S. history to receive an electoral vote.[35]
1980 presidential election
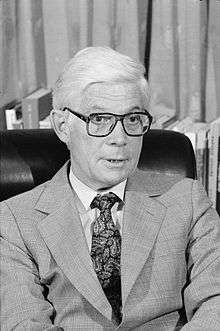
Congressman John B. Anderson received 5,719,850 votes, for 6.6% of the vote, as an independent candidate for President. Libertarian Party candidate Ed Clark won 921,128 votes, or 1.1% of the total. No other Libertarian candidate has ever gotten more than 0.5% in a presidential election until Gary Johnson won 1% in 2012.
1992 presidential election
Ross Perot, an independent, won 18.9% of the popular vote (but no electoral votes). His was the best popular vote showing ever for an independent candidate who stood alone on no third party ticket. Not until four years later would Perot seek to run for the first time on a third party ticket. As an independent, however, Perot finished second in two states: in Utah ahead of election winner Bill Clinton, and in Maine ahead of incumbent President George H. W. Bush.
1996 presidential election
Ross Perot ran for president again, this time as the candidate of the newly founded Reform Party. He won 8% of the popular vote.
References
- 1 2 All of John Floyd's electoral votes came from South Carolina where the Electors were chosen by the state legislatures rather than by popular vote
- ↑ The Central Pennsylvania Methodist
- ↑ "History of American Presidential Elections, Volume I 1789–1844, Arthur M. Schlesinger Jr., Pg 861
- ↑ "History of American Presidential Elections, Volume II 1848–1896, Arthur M. Schlesinger Jr., Pg 1487
- ↑ "History of American Presidential Elections, Volume II 1848–1896, Arthur M. Schlesinger Jr., Pg 1558
- 1 2 "History of American Presidential Elections, Volume II 1848–1896, Arthur M. Schlesinger Jr., Pg 1611
- 1 2 "History of American Presidential Elections, Volume II 1848–1896, Arthur M. Schlesinger Jr., Pg 1700
- ↑ "History of American Presidential Elections, Volume II 1848–1896, Arthur M. Schlesinger Jr., Pg 1784
- 1 2 "History of American Presidential Elections, Volume II 1848–1896, Arthur M. Schlesinger Jr., Pg 1874
- ↑ "History of American Presidential Elections, Volume III 1900–1936, Arthur M. Schlesinger Jr., Pg 1962
- 1 2 "History of American Presidential Elections, Volume III 1900–1936, Arthur M. Schlesinger Jr., Pg 2046
- 1 2 "History of American Presidential Elections, Volume III 1900–1936, Arthur M. Schlesinger Jr., Pg 2131
- ↑ "History of American Presidential Elections, Volume III 1900–1936, Arthur M. Schlesinger Jr., Pg 2242
- 1 2 "History of American Presidential Elections, Volume III 1900–1936, Arthur M. Schlesinger Jr., Pg 2345
- 1 2 "History of American Presidential Elections, Volume III 1900–1936, Arthur M. Schlesinger Jr., Pg 2456
- ↑ "History of American Presidential Elections, Volume III 1900–1936, Arthur M. Schlesinger Jr., Pg 2806
- ↑ "History of American Presidential Elections, Volume III 1900–1936, Arthur M. Schlesinger Jr., Pg 2914
- ↑ "History of American Presidential Elections, Volume IV 1940–1968, Arthur M. Schlesinger Jr., Pg 3211
- ↑ La Follette easily won his home state of Wisconsin, picking up 13 electoral votes.
- 1 2 3 4 Thurmond came in 1st place in four states, including his home state of South Carolina. He also received at least 5% of the vote in 7 other states, all in the South. Thurmond received all electoral votes in the states he won, as well as a vote from a faithless elector in Tennessee.
- 1 2 3 See Unpledged elector#Unpledged electors in the 20th century for more detail.
- ↑ The unpledged electors in the 1960 election voted for Virginia senator Harry F. Byrd for president, and South Carolina senator Strom Thurmond for vice president.
- 1 2 Byrd received all electoral votes in Mississippi, as well as 6 of 11 in Alabama and 1 from a faithless elector in Oklahoma.
- 1 2 3 4 5 Wallace was on the ballot in all 50 states, however not the District of Columbia. He reached the 5% threshold in 42 of those 50 states and won five, including his home state of Alabama. Wallace received 46 electoral votes, including 1 from a North Carolina faithless elector.
- ↑ Clark's third-place finish in Alaska was the only state where he received over 3% of the popular vote.
- ↑ Anderson received at least 5% of the vote in 37 states and the District of Columbia. His best showing was in Massachusetts, receiving over 15% of the popular vote. Anderson received no electoral votes.
- 1 2 Perot received at least 5% of the vote in all 50 states, however did not reach the threshold in the District of Columbia. He failed to win any state, and received no electoral votes.
- ↑ Perot came in second place in Maine, ahead of Republican George H. W. Bush.
- ↑ Perot's 8.72% of votes in Mississippi was his lowest percentage received in any state.
- ↑ Perot came in second place in Utah, ahead of Democrat Bill Clinton.
- ↑ Perot's best showing was in Maine, where he received over 14% of the popular vote.
- ↑ Perot's 5.59% of votes in Tennessee was his lowest percentage received in any state.
- ↑ Nader and LaDuke were on the ballot in 48 jurisdictions, and reached the threshold in 11 of them. His best showing was in Alaska, receiving over 10% of the vote.
- ↑ Despite not running in the general election, Sanders, who is a senator from Vermont, received nearly 6% of the vote, via write-ins.
- 1 2 "Libertarians trying to escape obscurity". Eugene Register-Guard. Associated Press. December 30, 1973. Retrieved July 30, 2012.













_circa_1915.jpg)



.svg.png)